Expanding the Cube Definition
In the previous chapter, we created and tested a simple cube. In this chapter, we expand that cube to use more parts of the Patient data and try more DeepSee features. This chapter discusses the following topics:
Adding a Level to a Hierarchy
So far, each dimension we have created has contained one hierarchy with one level. In this section, we add a level to the hierarchy in the HomeD dimension.
-
In the Architect, add a level to the HomeD dimension as follows:
-
In the Class Viewer, expand HomeCity.
-
Drag PostalCode and drop it onto the H1 hierarchy within the HomeD dimension.
This step adds the new level PostalCode after the City level.
-
Click PostalCode.
-
In the Details pane, change Name to ZIP Code.
-
-
Compile the cube.
When you do so, the Architect saves the cube.
-
Build the cube.
-
Access the Analyzer.
(If this is open on another browser tab, switch to that tab and click the DeepSee > Analyzer link to refresh with the most current model.)
-
Expand the HomeD dimension in the left. You should see the following:
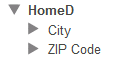
-
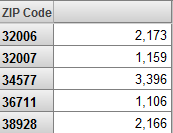
Display the ZIP Code levels as rows. You should see something like this:
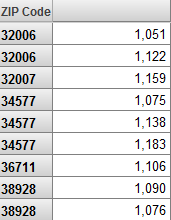
Notice that some members have the same name. It is sometimes correct to have multiple members with the same name. In this case, however, it is an error, because ZIP codes are unique.
There are only two ways in which a level can have multiple members with the same name:
-
The level name is based on a level property, which is not unique. (For an example, see the Doctor level that we defined in the previous chapter.)
-
The level has a parent level. When DeepSee creates members of a level, it considers not only the source property or expression; it also considers the parent member.
In reality, there is a many-to-many relationship between ZIP codes and cities, so that neither is the parent of the other. In the Patients sample, ZIP codes contain small cities as follows:
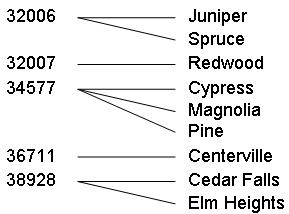
When we added the ZIP Code level, we placed it after the City level, which means that City is the parent of ZIP Code. This affected how the system generated members for ZIP Code. For example, the system assumed that the ZIP code 32006 of the city Juniper was not the same as the ZIP code 32006 of the city Spruce.
-
-
Go back to the Architect and correct the HomeD dimension.
-
Click the ZIP Code level.
-
Click the up arrow button.
-
Compile the cube.
When you do so, the Architect saves the cube.
-
Build the cube.
-
-
Access the Analyzer.
(If this is open on another browser tab, switch to that tab and click the DeepSee > Analyzer link to refresh with the most current model.)
-
Expand the HomeD dimension in the left. You should see the following, which is now correct:
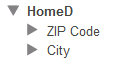
-
Display the ZIP Code levels as rows. Now you should see something like this, which is correct:
-
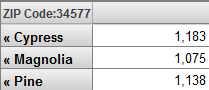
Double-click the row 34577. The system now displays the cities within this ZIP code.
-
Optionally do the following to see how this change has affected the fact and level tables.
-
Access the Management Portal and go to the SAMPLES namespace, as described earlier.
-
Click System Explorer > SQL.
-
In the left area, navigate to the table Tutorial_Cube.Fact.
Notice that this table now has the field DxPostalCodeViaHomeCity in addition to DxNameViaHomeCity. That is, the fact table stores a value for each level, even the levels are related.
-
In the left area, navigate to and open the table StarNameViaHomeCity.
The system displays something like the following:
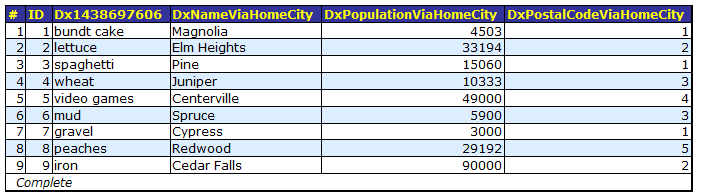
Notice that now the table stores, for each city, the ZIP code to which that city belongs.
-
Close this table and navigate to the table Tutorial_Cube.StarPostalCodeViaHomeCity.
The system displays something like the following:
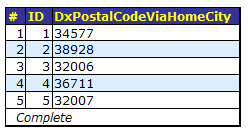
This level table is like the other level tables: one row for each level member.
-
Adding Time Levels
In this part of the tutorial, we add time levels to the cube.
The Patients class includes the patient’s birth date in several forms (so that you can try different formats with DeepSee):
Property BirthDate As %Date;

Property BirthDateTimeStamp As %TimeStamp;

Property BirthDateMV As %MV.Date;
DeepSee has built-in support for all three of these formats, as well as for $HOROLOG format and others (for details, see Defining DeepSee Models).
The class also includes the patient’s birth time, as part of the BirthDateTimeStamp property or as the following property:
Property BirthTime As %Time;The most flexible property is BirthDateTimeStamp, because it contains both the birth date and the birth time, so we will use that as the basis for the time levels.
-
Access the Architect and display the Tutorial cube.
-
Click Add Element.
-
For Enter New Element Name, type BirthD.
-
Click Time Dimension.
-
Click OK.
The system creates a dimension, hierarchy, and level.
-
Make the following change to the dimension:
-
Click the search button next to Property, click BirthDateTimeStamp, and click OK.
-
-
Make the following changes to the level:
-
Rename the level to Year.
-
For Extract value with function, select Year.
This option means that this level is based only the patients’ birth years.
-
-
Add another level as follows:
-
Click the hierarchy H1 in this dimension.
-
Click Add Element.
-
For Enter New Element Name, type Month Year.
-
Click Level.
-
Click OK.
The system creates a new level in the hierarchy H1, after the existing Year level.
-
-
For the Month Year level, make the following change:
-
For Extract value with function, select MonthYear.
This option means that this level is based on the combined birth year and month.
-
-
Add another hierarchy and level to the BirthD dimension, as follows:
-
Click the dimension name.
-
Click Add Element.
-
For Enter New Element Name, type H2.
-
Click Hierarchy.
-
Click OK.
The system creates a new hierarchy and level.
-
For the new level, make the following changes:
-
Rename the level to Time.
-
For Extract value with function, select HourNumber.
This option means that this level is based on the time of day the patient was born.
-
-
-
Compile the cube.
When you do so, the Architect saves the cube.
-
Build the cube.
-
Access the Analyzer.
(If this is open on another browser tab, switch to that tab and click the DeepSee > Analyzer link to refresh with the most current model.)
-
Try the new levels. You should see the following:
-
When you expand Year in the left area, you see this:
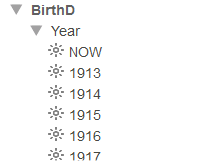
NOW is a special member that refers to the current year (in this context).
-
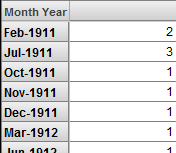
The Month Year level also has a NOW member, which refers to the current year and month.
-
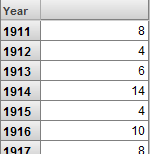
When you use Year as rows, you should see something like this:
-
When you use Month Year as rows, you should see something like this:
-
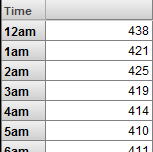
When you use Time as rows, you should see something like this:
-
The system does not generate tables for time levels, which have special internal handling.
Using a Collection Property
You can create levels based on collection properties. Specifically, the system can directly use either a list of the type returned by $LIST, %ListOpens in a new tab, or a character-delimited list. If a collection property stores data in some other way, it is necessary to extract the necessary data and create one of the supported types of lists.
The DeepSee.Study.Patient class has several collection properties, including Allergies and DiagnosesAsLB. The DiagnosesAsLB property is defined as follows:
Property DiagnosesAsLB As %List;The Allergies property is defined as follows:
Property Allergies As list Of DeepSee.Study.PatientAllergy;This part of the tutorial shows you how to create levels and measures that use these properties:
-
Access the Architect and display the Tutorial cube.
-
Add a dimension, hierarchy, and level that uses the DiagnosesAsLB property, as follows:
-
Click Add Element.
-
For Enter New Element Name, type DiagD.
-
Click Data Dimension.
-
Click OK.
The system creates a dimension, hierarchy, and level.
-
Rename the level to Diagnoses.
-
While the level is selected, click the search button for Property, select the DiagnosesAsLB property, and click OK.
-
For Source value is a list of type, click $LIST. This type refers to data that has the format returned by the $LIST function or that has the type %ListOpens in a new tab.
-
Save the cube class.
-
-
In the Architect, add a dimension, hierarchy, and level as before, with the following changes:
-
The dimension name should be AllerD.
-
The level name should be Allergies.
-
Do not specify a value for Property.
There is no property that we can use directly. It will be necessary to extract the list of allergies via an expression.
-
Specify the following value for Expression:
##class(Tutorial.Cube).GetAllergies(%source.%ID)The system evaluates this expression once for each row in the fact table, when it builds the cube.
The variable %source refers to the current record. This expression gets the ID of the patient, invokes the utility method (which we have not yet written), and returns a list of allergies for the patient.
-
Remember to select $LIST for Source value is a list of type.
Then save your cube class.
The next step will be to write this utility method.
-
-
Open Studio and access the SAMPLES namespace.
-
Open your cube class, Tutorial.Cube.
-
Add a method named GetAllergies(), as follows:
ClassMethod GetAllergies(ID As %Numeric) As %List
{
    Set allergies=##class(DeepSee.Study.Patient).%OpenId(ID,0).Allergies
    If (allergies.Count()=0) {Quit $LISTFROMSTRING("")}
    Set list=""
    For i=1:1:allergies.Count() {
        Set $LI(list,i)=allergies.GetAt(i).Allergen.Description
        }
    Quit list
}
Given the ID of a patient, this method returns a list of allergies of that patient, in the format expected by the level we created.
The second argument of %OpenId() specifies the level of concurrency locking to use. Because we only need to read data from the object, we specify this value as 0, which establishes no concurrency locking and thus runs more quickly.
-
Save and compile your cube class in Studio.
-
Add a measure that contains the number of allergies that a patient has. To do so, we use the Allergies property, as follows:
-
Return to the Architect.
-
Click Add Element.
-
For Enter New Element Name, type Avg Allergy Count.
-
Click Measure.
-
Click OK.
The new measure is added to the table.
-
Click the measure in the Model Contents area.
-
For Aggregate, click AVG.
-
For Expression, enter the following:
##class(Tutorial.Cube).GetAllergyCount(%source.%ID)We will have to write this method later.
-
Save the cube class in the Architect.
-
Because you have edited the class in Studio, the Architect displays a dialog box that asks whether you want to override the stored definition. Click OK. The Architect overrides only the parts of the class definition that you can edit in the Architect; that is, it does not override any methods you have added to the class.
-
In Studio, add the following method to your cube class:
ClassMethod GetAllergyCount(ID As %Numeric) As %Numeric { Set allergies=##class(DeepSee.Study.Patient).%OpenId(ID,0).Allergies Quit allergies.Count() } -
Save and compile the cube class in Studio.
-
-
Rebuild the DeepSee cube.
To do this, you can return to the Architect and rebuild the same way that you did before.
Or you can open a Terminal window and enter the following command in the SAMPLES namespace:
do ##class(%DeepSee.Utils).%BuildCube("tutorial")Notice that the method uses the logical name of the cube (rather than the class name). Also notice that the cube name is not case-sensitive.
-
Access the Analyzer.
(If this is open on another browser tab, switch to that tab and click the DeepSee > Analyzer link to refresh with the most current model.)
-
Display the Diagnoses level as rows. You should see the following:
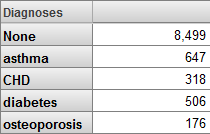
In your data, you might also see the epilepsy diagnosis, which is more rare.
You might instead see something like the following:
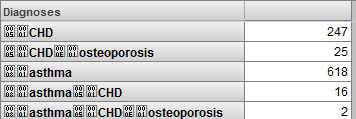
This occurs if you do not specify the appropriate type for Source value is a list of type.
-
Click New.
-
Display the new Allergies level as rows, and display the Count and Avg Allergy Count measures. You should see something like the following:
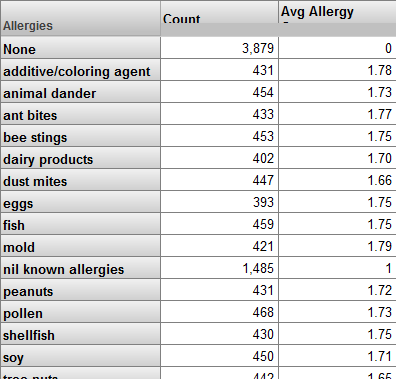
The nil known allergies member represents the patients who have no known allergies. Some medical information systems use the following technique to record the fact that a patient has no known allergies:
-
The system includes a special “allergen” called nil known allergies.
-
A user of the system asks the patient whether he or she has any allergies, and if the answer is “No,” the user selects the value nil known allergies.
DeepSee does not assign any special meaning to this string. The dimension treats this “allergen” in the same way as any other allergen.
The null member (called None) represents the patients whose Allergies property is null. Because it is incorrect to assume that these patients have no allergies, the name of this member is misleading. A better name would be No Data Available.
Notice that the Avg Allergy Count measure is 0 for patients who belong to the null member. The Avg Allergy Count measure should be null for these patients.
Also notice that the Avg Allergy Count measure is 1 for patients with no known allergies. This is because the Allergies property does include the special nil known allergies allergen. The Avg Allergy Count measure should be 0 for these patients.
Later in this section, we will correct the name of the null member and adjust our logic for the Avg Allergy Count measure.
-
-
Return to the Architect.
-
Click the Allergies level.
-
For Null replacement string, specify No Data Available.
-
Save the cube class.
-
In Studio, edit the method GetAllergyCount() as follows:
ClassMethod GetAllergyCount(ID As %Numeric) { Set allergies=##class(DeepSee.Study.Patient).%OpenId(ID,0).Allergies //check to see if patient has any recorded allergy data //if not, count is null If allergies.Count()=0 { Set allcount="" } //check to see if patient has "Nil known allergies" //in this case, the patient has one "allergen" whose code is 000 Elseif ((allergies.Count()=1) && (allergies.GetAt(1).Allergen.Code="000")) { Set allcount=0 } Else { Set allcount=allergies.Count() } Quit allcount } -
Save the cube class.
-
Compile the cube class in Studio or in the Architect.
-
Build the cube in the Architect.
-
Access the Analyzer.
(If this is open on another browser tab, switch to that tab and click the DeepSee > Analyzer link to refresh with the most current model.)
-
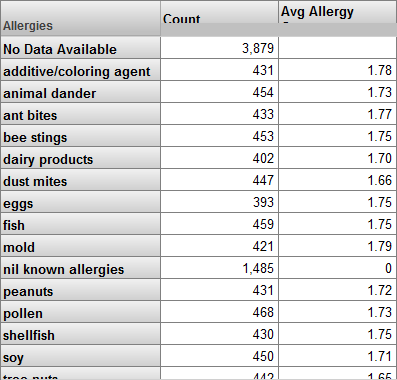
Display the Allergies as rows, and display the Count and Avg Allergy Count measures. Now you should see something like the following:
-
Optionally do the following to see how list-based levels are represented in the fact and level tables.
-
Access the Management Portal and go to the SAMPLES namespace, as described earlier.
-
Click System Explorer > SQL.
-
In the left area, navigate to and open the table Tutorial_Cube.Fact and scroll to the field DxDiagnosesAsLB.
The system displays something like the following:
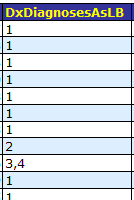
This field contains the diagnoses for the patients. Notice that it contains multiple values in some cases.
The table also displays the allergies level, perhaps like this:
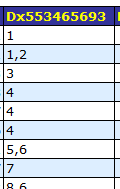
The name of this field is less obvious, because it is generated, because the level itself is based on an expression.
Because this is another list-based level, it contains multiple values in some cases.
-
Now navigate to and open the table Tutorial_Cube.StarDiagnosesAsLB.
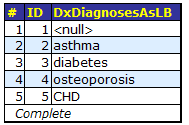
This level table is like the other level tables: one row for each level member.
The level table for allergies is similar: one row for each level member.
-
The method we used for Avg Allergy Count was fairly simple. Consider the following method:
ClassMethod GetScore(ID As %Numeric) As %String
{
    //get customer rating data & call duration from source record
    set call=##class(MyPackage.MyClass).%OpenId(ID,0)
    set professionalism=call.Professionalism
    set knowledge=call.Knowledge
    set speed=call.OpenDuration

    If ...
        //logic to check for nulls and combine these values into weighted overall score
    Quit score
}
You could use a method like this to define a measure that indicates an overall score.
Defining Replacements
In this part of the tutorial, we use options that transform the original values for levels into other values. Here we will use the Age property of the patient. We will define levels that place patients into buckets that are larger than one year.
The Age Group level will have the following members:
-
The 0 to 29 member consists of the patients who are less than 30 years old.
-
The 30 to 59 member consists of the patients who are between 30 and 59, inclusive.
-
The 60+ member consists of the patients who are older than 60 years.
Similarly, the Age Bucket level will have the members 0 to 9, 10 to 19, and so on.
-
Access the Architect.
-
Add another level to the AgeD dimension as follows. To do so:
-
Click the Age level. This ensures that the new level, which is less granular, will be added before the Age level.
-
Click Add Element.
-
For Enter New Element Name, type Age Group.
-
Click Level.
-
Click OK.
-
-
Redefine the new Age Group level to have a range expression, as follows:
-
Click the new Age Group level.
-
For Field name in fact table, specify DxAgeGroup
This will make it easier for us to see how the level definition affects the generated tables.
-
For Property, type Age.
-
Click the search button next to Range Expression.
The system displays a dialog box where you specify a set of replacements. Originally, this dialog box looks like this:
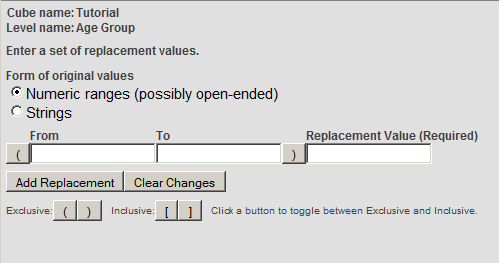
For numeric data, for each replacement, you specify a range of original values, as well as a new value to use instead.
-
Type 29 into To.
The button to the right of To is initially as follows:

-
Click this button to change it to this:

-
Type 0 to 29 into Replacement Value. The result is as follows:
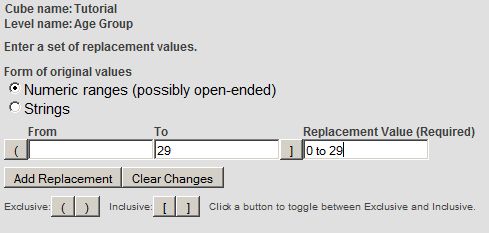
It does not matter which button is next to From, because no value is specified for the lower end of this range.
-
Click Add Replacement.
-
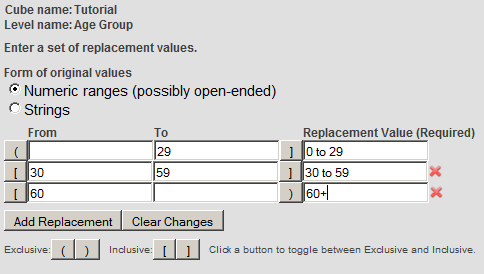
In the new row, click the toggle buttons next to From and To.
-
Type 30 into From and type 59 into To.
-
Type 30 to 59 into Replacement Value.
-
Click Add Replacement and add the final row so that the result is as follows:
-
Click OK.
The system closes the dialog box and displays a value in the Range expression field as follows:
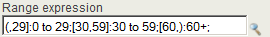
This value shows the syntax that DeepSee uses internally to represent the replacements that you specified.
-
-
Save the cube.
For the Age Bucket level, we could use the same technique. Instead, however, we will use an alternative: a source expression that converts an age in years into a string that corresponds to the appropriate ten-year bucket.
-
In Studio, open the class DeepSee.Model.PatientsCube.
-
Look at the definition of the method GetAgeBucket(), which is as follows:
ClassMethod GetAgeBucket(age As %Numeric) As %String
{
    If (age="") {Set return=""}
    ElseIf (age<10) {Set return="0 to 9"}
    ElseIf (age<20) {Set return="10 to 19"}
    ElseIf (age<30) {Set return="20 to 29"}
    ElseIf (age<40) {Set return="30 to 39"}
    ElseIf (age<50) {Set return="40 to 49"}
    ElseIf (age<60) {Set return="50 to 59"}
    ElseIf (age<70) {Set return="60 to 69"}
    ElseIf (age<80) {Set return="70 to 79"}
    ElseIf (age>=80) {Set return="80+"}
    Else {Set return=""}
    Quit return
}
Notice that the input to this method is just a number, rather than a patient identifier.
-
In the Architect, add another level to AgeD as follows:
-
Click the Age level. This ensures that the new level, which is less granular, will be added before the Age level.
-
Click Add Element.
-
For Enter New Element Name, type Age Bucket.
-
Click Level.
-
Click OK.
The new level is added just before Age, but after Age Group.
-
For Field name in fact table, specify DxAgeBucket
This will make it easier for us to see how the level definition affects the generated tables.
-
For Expression, enter the following:
##class(DeepSee.Model.PatientsCube).GetAgeBucket(%source.Age)
Note:In practice, you are more likely to include utility methods in a central location such as the cube class that uses them (rather than some other cube as in this case). One point of this exercise is to demonstrate that you can invoke any class method that is accessible in this namespace. Similarly, you can invoke any routine or system function.
-
-
Save the cube.
Because you have edited the class in Studio, the Architect displays a dialog box that asks whether you want to override the stored definition. Click OK. The Architect overrides only the parts of the class definition that you can edit in the Architect; that is, it does not override any methods you have added to the class.
-
Compile the cube.
-
Rebuild the cube.
-
Access the Analyzer.
(If this is open on another browser tab, switch to that tab and click the DeepSee > Analyzer link to refresh with the most current model.)
-
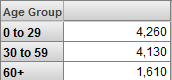
Display the new Age Group level as rows. You should now see something like the following:
-
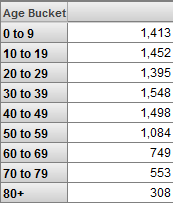
Display the new Age Bucket level as rows. You should now see something like the following:
-
Examine one of the new level tables to understand what the system has done:
-
Access the Management Portal and go to the SAMPLES namespace, as described earlier.
-
Click System Explorer > SQL.
-
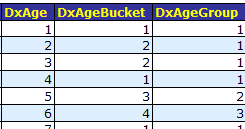
In the left area, navigate to and open the table Tutorial_Cube.Fact.
This table now has three fields to store the values for the levels of the AgeD hierarchy:
-
Navigate to and open the table Tutorial_Cube.DxAgeGroup.
The system displays something like the following:
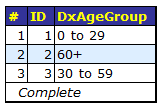
The system used your range expression to create this data.
-
Open the table Tutorial_Cube.DxAgeBucket.
The system displays something like the following:
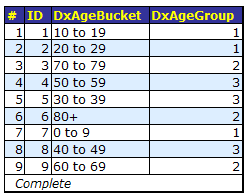
Because this level is not at the top of the hierarchy, it contains a reference, for each element, to the its parent member in the Age Group level; see the DxAgeGroup column.
The system used the GetAgeBucket() method to create this data.
-
These two levels are defined in an equivalent fashion. That is, using the Range Expression option is equivalent to executing your own method to provide a conversion. A method can include logic that is much more complex than simple replacements. Consider the following method:
ClassMethod GetClassification(ID As %Numeric) As %String
{
    //get customer rating data & call duration from source record
    set customer=##class(MyPackage.MyClass).%OpenId(ID,0)
    set detail1=customer.Detail1
    set detail2=customer.Detail2
    set detail3=customer.Detail3
    ...

    If ...
        //logic to use these details and return a string, either "A", "B", or "C"
    Quit classification
}
You could use a method like this to populate a level that groups customers based on an algorithm that uses multiple pieces of information about the customers.
Accessing Other Classes
The DeepSee Architect provides easy access to most of the properties within the base class, but we can use other properties, as well, including properties of classes that you can access only via SQL. In this part of the tutorial, we use data in the DeepSee.Study.PatientDetails class as levels in our cube.
The DeepSee.Study.Patient and DeepSee.Study.PatientDetails classes are not connected by a class property and do not have any formal connection. Instead, both tables have a PatientID property, which connects them by convention. That is, to find information for a given patient, you must find the records that have the same PatientID in these two tables.
In this exercise, we examine the data in DeepSee.Study.PatientDetails, try various SQL queries, and wrap a query in a method for use in defining a level. If you are more adept with SQL, you might want to skip some of the earlier steps.
-
Access the Management Portal and go to the SAMPLES namespace, as described earlier.
-
Click System Explorer > SQL.
-
Click the Execute Query tab.
-
Execute the following query:
SELECT PatientID FROM DeepSee_Study.Patient -
Make a note of one of the PatientID values, for future reference.
-
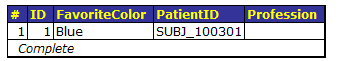
Execute the following query:
SELECT * FROM DeepSee_Study.PatientDetails WHERE PatientID='SUBJ_100301'The system displays something like the following:
-
Execute the following query:
SELECT FavoriteColor FROM DeepSee_Study.PatientDetails WHERE PatientID='SUBJ_100301'The system displays something like the following:
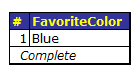
This query returns one value, the string Blue.
Now we need to write a class method that runs a similar query and returns the value obtained by the query.
This method will contain a query wrapped in &sql(). We need to make the following changes to the query:
-
Instead of FavoriteColor, we must use FavoriteColor INTO :ReturnValue so that the returned value is written to a host variable named ReturnValue.
-
Instead of using 'SUBJ_100301', we must pass in the PatientID field of the base class.
After executing the embedded SQL, the method should check the variable SQLCODE, which is 0 only for a successful query. The query would be unsuccessful if no record was found. In such a case, it would be appropriate to return an empty string.
-
-
In Studio, add the following method to your cube class, Tutorial.Cube:
ClassMethod GetFavoriteColor(patientID As %String) As %String { &sql(SELECT FavoriteColor INTO :ReturnValue FROM DeepSee_Study.PatientDetails WHERE PatientID=:patientID) If (SQLCODE'=0) { Set ReturnValue="" } Quit ReturnValue }Note:There is an index on the PatientID field in DeepSee.Study.PatientDetails. This enables the query to run more quickly than it would otherwise.
If an application does include tables that can be related most easily through SQL queries, as in this example, it probably already has indices on the relevant fields. Whenever you write a method like this, however, you should make sure that the appropriate indices exist.
-
Save and compile the class.
-
In the Terminal, test the method as follows:
SAMPLES>write ##class(Tutorial.Cube).GetFavoriteColor("SUBJ_100301") Blue -
Access the Architect.
-
Create a new dimension, hierarchy, and level, as follows:
-
Click Add Element.
-
For Enter New Element Name, type ColorD.
-
Click Data Dimension.
-
Click OK.
The system creates a dimension, hierarchy, and level.
-
Rename the level to Favorite Color.
-
For Field name in fact table, specify DxFavColor
This will make it easier for us to see how the level definition affects the generated tables.
-
For the level, type the following into Expression:
##class(Tutorial.Cube).GetFavoriteColor(%source.PatientID)This expression is executed when you build the indices; see the notes about performance in the previous step.
-
-
Save the cube.
Because you have edited the class in Studio, the Architect displays a dialog box that asks whether you want to override the stored definition. Click OK. The Architect overrides only the parts of the class definition that you can edit in the Architect; that is, it does not override any methods you have added to the class.
-
Compile the cube.
-
Rebuild the cube.
The system executes your method and its embedded SQL once for each record in the base table.
-
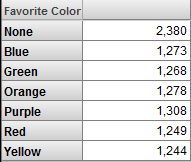
Open the Analyzer and display the new level as rows. Now you should see something like the following:
-
Optionally open the level table for this level:
-
Access the Management Portal and go to the SAMPLES namespace, as described earlier.
-
Click System Explorer > SQL.
-
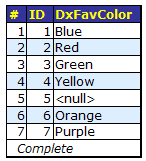
In the left area, navigate to and open the table Tutorial_Cube.DxFavColor.
The system displays something like the following:
-