Creating and Packaging Pivot Tables and Dashboards
After creating one or more cubes, you typically create and package a set of initial pivot tables and dashboards, and users typically create new pivot tables and dashboards as needed.
This chapter briefly leads you through the process of creating pivot tables and dashboards. It consists of the following steps:
For much more information on creating pivot tables and dashboards, see Using the DeepSee Analyzer and Creating DeepSee Dashboards.
Creating Pivot Tables
Earlier in this tutorial, we created a pivot table that uses the Patients cube. Now let us create pivot tables that use your new cube.
-
Access the Analyzer.
-
Navigate to the Tutorial cube.
-
Expand the AgeD dimension in the Model Contents pane.
-
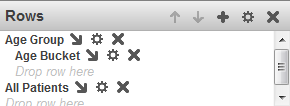
Drag and drop Age Group to Rows.
-
Drag Age Bucket to Rows and drop it onto the Breakout Here button
 .
. -
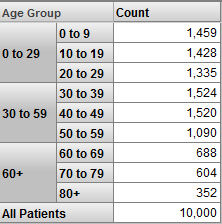
Drag and drop Count to Columns.
-
Drag and drop All Patients to Rows, at the bottom.
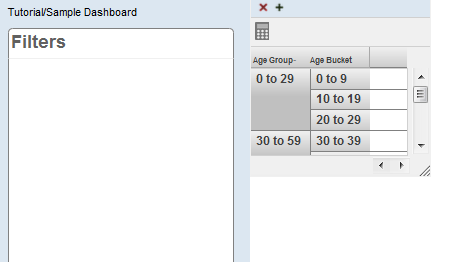
The Rows box now looks like this:
The pivot table is as follows:
-
Click Save.
The system displays a dialog box where you specify the pivot table name.
Save the pivot table and give it a name. Here, we are saving the underlying query that retrieves the data, along with the information needed to display it the way you chose. We are not saving the data.
-
For Folder, type Tutorial
-
For Pivot Name, type Patients by Age Group
-
Click OK.
-
Create another pivot table as follows:
-
For Rows, use Diagnoses
-
For Columns, use Count and Avg Age
-
For Folder, select or type Tutorial
-
For Pivot Name, type Patients by Diagnosis
-
Creating a Dashboard
In this section we create a simple dashboard.
-
Click the DeepSee link at the top of the page.
-
Click Home,DeepSee,User Portal.
The system then displays the User Portal, which lists the existing public dashboards and pivot tables.
-
Click Menu > New Dashboard.
The system displays a dialog box that prompts you for basic information about the new dashboard.
-
For Folder, type or select Tutorial
-
For Dashboard Name, type Sample Dashboard
-
Click OK.
The system creates, saves, and displays the dashboard, which is initially empty.
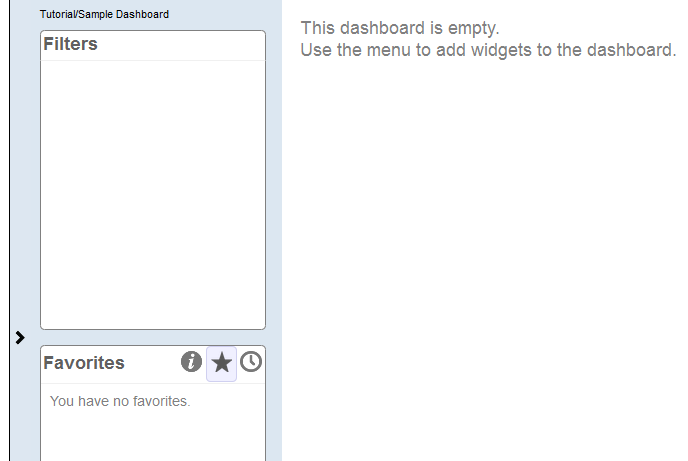
Notice the > button on the left side of the dashboard.
-
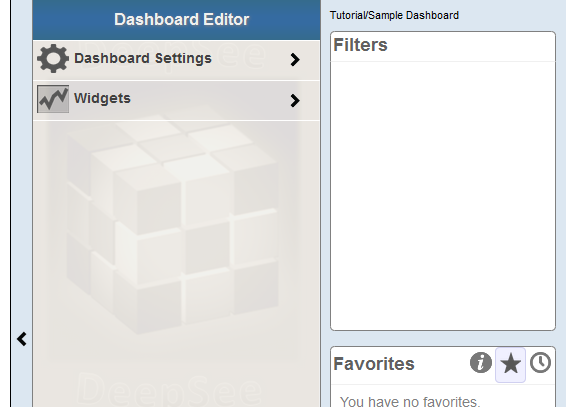
Click the > button.
This step expands the Dashboard Editor, as follows:
-
Click Widgets.
This step displays a list of any widgets that this dashboard currently contains (none in this case).
-
Click the + button.
This step displays a dialog box where you can choose some initial options.
-
In the dialog box, click Pivots and Charts, if this is not already expanded. The list expands to show a list of choices.
-
In this list, click Table.
-
Click the Search button
 next to Data source.
 -
Click Tutorial and then click Patients by Age Group
-
Click OK to add this widget.
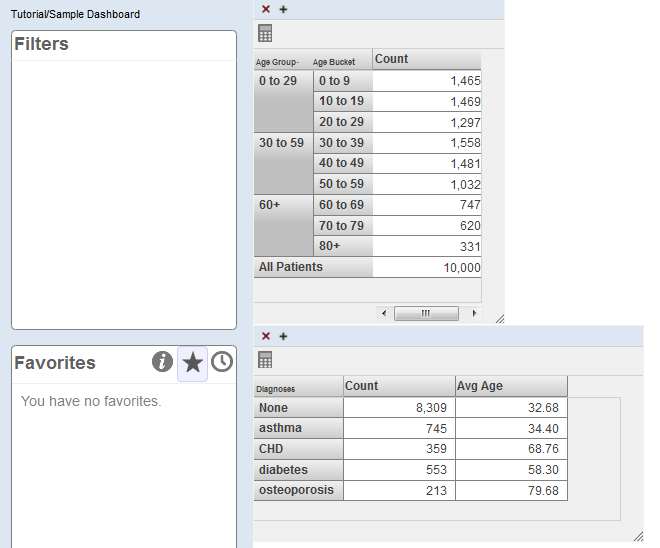
The system displays the dashboard like this:
-
Repeat the preceding steps to add the other pivot table that you created in the previous section.
The newly added widget is placed in the same default position (in the upper left) and therefore covers the previously added widget.
-
Put the cursor into the title bar of the newly added widget and then drag this widget and drop it below the other widget.
You might want to leave space below the upper widget so that you can resize it.
-
Use the resize control in the lower right corner of each widget to resize it so that all rows are visible without scrolling.
-
Click Menu > Save.
The system saves the dashboard immediately.
-
Do the following to add some filter controls to this dashboard:
-
Open the Dashboard Editor.
-
Click Widgets.
-
Click the Patients by Age Group widget.
-
Click Controls.
The Dashboard Editor displays a list (currently empty) of any controls defined on the selected widget.
-
Click the plus sign button above the list.
The system displays a dialog box where you specify the control.
-
For Location, select Dashboard.
-
For Target, type *
-
For Action, select Apply Filter.
-
For Filter, select ZIP Code
-
For Control Label or Icon, type ZIP Code
-
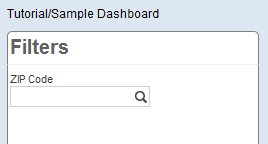
Click OK to add the control.
Now the upper left corner of the dashboard is as follows:
-
-
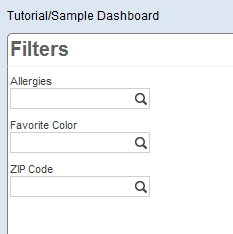
Repeat the preceding steps to add the Allergies and Favorite Color filters.
Now the upper left corner of the dashboard is as follows:
-
Reconfigure these filter controls so that each one has a default value. To reconfigure the ZIP Code filter:
-
Open the Dashboard Editor.
-
Access the definition of the Patients by Age Group widget.
-
Click Controls.
-
Click the ZIP Code control.
-
For Default Value, type 32007 and click the check mark.
-
Click Done.
For Allergies, use the default value soy
For Favorite Color, use the default value blue
As you make these changes, the system automatically saves them.
-
-
Test the dashboard and verify the following:
-
If you use the browser’s refresh button, each filter should show the correct default value.
-
Each filter should affect both widgets.
-
Exporting and Packaging the Pivot Tables and Dashboards
-
Click Menu > Management Portal.
If you do not see this option, you are currently logged in as a user without direct access to the DeepSee development tools. In this case, log in again to DeepSee as described earlier in this book.
-
Click DeepSee > Admin > Folder Manager.
The system then displays the Folder Manager.
-
Scroll to the Tutorial folder, which should look something like this:
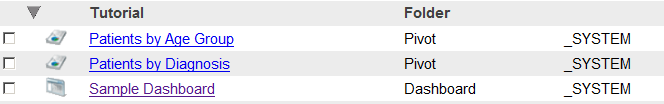
The column on the right indicates the Caché user who created these items; you may see different values there.
-
Click the check box to the left of Sample Dashboard. The left area of the page now lists the pivot tables used by this dashboard:
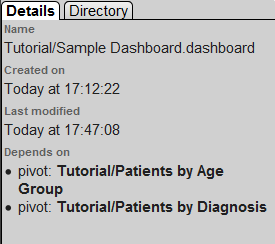
Both of these pivot tables are in the same folder as the dashboard itself, which is not required.
-
Click the check box to the left of the two newer pivot tables as well.
-
For Directory, type the name of an existing directory to which you have write permission.
-
Click Export.
The system then writes three files to that directory.
You could use these files as a package for the items you have defined, but in the next set of steps, we will use a more convenient approach.
-
In Studio, create a new class called Tutorial.DashboardsAndPivots. The class should extend %DeepSee.UserLibrary.ContainerOpens in a new tab.
-
In the new class, add an XData block named Contents, as follows:
XData Contents [ XMLNamespace = "http://www.intersystems.com/deepsee/library" ] { <items> </items> } -
Save the new class.
-
Copy the dashboard and pivot table definitions from your exported files into this XData block:
-
Use a text editor to open the dashboard file (Tutorial-Sample_Dashboard.xml), which looks as follows:
<?xml version="1.0" encoding="UTF-8"?> <dashboard xmlns="http://www.intersystems.com/deepsee/library" folderName="Tutorial" name="Sample Dashboard" ... ... </dashboard> -
Copy the contents of this file, starting with the second line and ending at the end of the file. That is, do not copy the first line, which is the XML declaration.
-
Paste the copied text into the XData block between <items> and </items>. Now you should see this:
XData Contents [ XMLNamespace = "http://www.intersystems.com/deepsee/library" ] { <items> <dashboard xmlns="http://www.intersystems.com/deepsee/library" folderName="Tutorial" name="Sample Dashboard" ... ... </dashboard> </items> } -
Use a text editor to open one of the pivot table files, which has a similar structure (with <pivot> instead of <dashboard>).
-
Copy the contents of this file, , starting with the second line and ending at the end of the file.
-
Paste the copied text into the XData block between </dashboard> and </items>. Now you should see something like this:
XData Contents [ XMLNamespace = "http://www.intersystems.com/deepsee/library" ] { <items> <dashboard xmlns="http://www.intersystems.com/deepsee/library" folderName="Tutorial" name="Sample Dashboard" ... ... </dashboard> <pivot xmlns="http://www.intersystems.com/deepsee/library" folderName="Tutorial" name="Patients by Age Group" ... ... </pivot> </items> }Note:You could instead insert the copied text between <items> and <dashboard>. The order of the items has no effect on anything.
-
Repeat the preceding steps with the other pivot table file.
-
Save the class definition.
-
-
Return to the Folder Manager and refresh the page.
This clears any selections you may have made.
-
Click the check box next to each of the three items in the Tutorial folder.
-
Click Delete and then click OK to confirm.
-
In Studio, compile the class you just created.
When you do this, the system imports the dashboard and pivot table definitions contained in that class.
-
Return to the Folder Manager and refresh the page. Notice that the tutorial dashboard and pivot tables are available again.
You can include as many dashboards and pivot tables as needed in a container class like this, and you can have multiple container classes. There are no requirements to organize the dashboards and pivot tables in any particular way in these container classes. For example, you do not need to place the pivot tables in the same container class as the dashboards that use them. There is also no requirement to create these container classes at all.