Working with Pivot Tables
This chapter discusses how to work with pivot tables. It discusses the following topics:
Opening a Saved Pivot Table
To open a saved pivot table:
-
Click Open. Or click Menu > Open.
The system displays a dialog box, which shows names of folders and of pivot tables that are not in any folders.
-
Optionally click the name of a folder.
The dialog box then shows the contents of that folder.
Repeat as necessary if your folders are nested.
-
Click the name of the pivot table you want to open.
-
Click Go.
The system closes the dialog box and then displays the selected pivot table in the Analyzer.
In most cases, the underlying query is executed automatically. If it is not, click the Refresh button  . See the next topic.
Disabling and Enabling Auto-Execution
By default, when you make any change to the pivot table, the Analyzer re-executes the query and redisplays the results. You can disable this auto-execution. To do so, clear the Auto-execute option on the toolbar.
Later, to enable auto-execution, select the Auto-execute option.
If you disable auto-execution and save the pivot table, that change is saved as part of the pivot table definition and affects the behavior of any dashboards that use the pivot table. Therefore, you should be careful to make this change and save it only if you do not want the pivot table to run automatically in dashboards. Be sure to include a refresh control in any widget that displays this pivot table.
Canceling a Running Query
While the Analyzer is executing a query, you can cancel it. To do so, click the Cancel Query button  .
.
Exporting Data to Microsoft Excel
You can export data to Microsoft Excel from a pivot table widget, but not from other types of widgets. To do so, click the Export to Excel button  in the widget.
The system then generates an Excel file that contains all the data currently displayed in the widget. The file has the name %DeepSee.UI.MDXExcel.zen.xls, %DeepSee.UI.MDXExcel.zen-1.xls, or similar. Your browser then does one of the following, depending on your operating system, the configured file types on your machine, your browser, and your browser settings:
-
Opens the file with Excel (or other selected program).
You specify the program to use by setting a browser option. For example, on Firefox, you use Tools > Options > Applications. This option also enables you to specify whether the browser should open the file with this program or prompt you to save it to the hard drive.
-
Prompts you to open the file with Excel (or other selected program, as described in the previous bullet).
-
Opens this file within the current browser window.
This is the default behavior for Windows operating systems earlier than Windows Vista. You can change this behavior on the Edit File Type dialog box (which you access via My Computer > Tools > Folder Options or My Computer > View > Options, depending on the operating system version).
This option is not available on Windows Vista and later Windows operating systems.
-
Prompts you to save the file to the hard drive.
-
Automatically saves the file to the hard drive.
When you export to Excel, note that it is not possible to export more than 250000 rows. Also, if the cube is based on a data connector that uses an external table, there is a limit of 1000 rows in the listing.
If no numeric formatting is specified, any numbers are formatted as integers by default. (The actual values are available in Excel, and you can change the formatting as needed to display them appropriately). If numeric formatting is specified in the model or in the pivot table definition, that formatting is used in Excel.
Printing a Pivot Table
To print a pivot table from the Analyzer, click the Print button  . DeepSee generates a .pdf file and opens it in your default browser. You can then use options in the browser to print the file or to download it, for printing later.
Note that if you download the file, the browser saves the file to the default download directory for that browser; there is no mechanism for DeepSee to specify a different location.
Also see “Specifying the Print Settings,” earlier in this book.
Requirements for Printing
When a user invokes the Print option, Caché uses Java to call out to a third-party PDF rendering tool. This means that Java (or specifically JRE, Java Runtime Environment) is required on the user’s machine. For information on the requirements, which also apply to Zen Reports, see “Configuring Zen Reports for PDF Output” in Using Zen Reports.
Sending Email
You can send email that contains a link to the pivot table, if your system is configured for this. To do so:
-
Open a pivot table that contains the data about which you want to send a message.
-
Click Menu > Send Email.
If this option is not present, then your system is not configured to support email.
-
The system then does one of the following:
-
Displays the default email system on your machine, with a message that contains a link to the dashboard.
Edit the message, specify one or recipients, and send it as usual.
-
Displays a dialog box.
Choose a recipient, type a brief message to include along with the generated link, and click OK.
-
Displaying the Pivot Table as a Chart
By default, the Analyzer displays the results in table format. You can use the buttons in the upper left to switch to other formats.
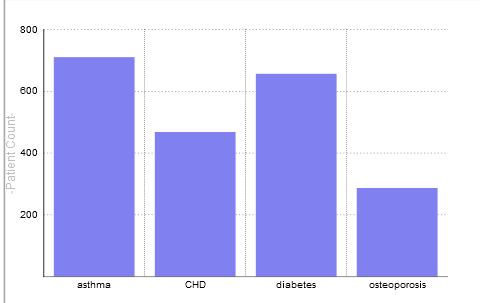
To display the results as a chart, click the Display As Chart button  . For example:
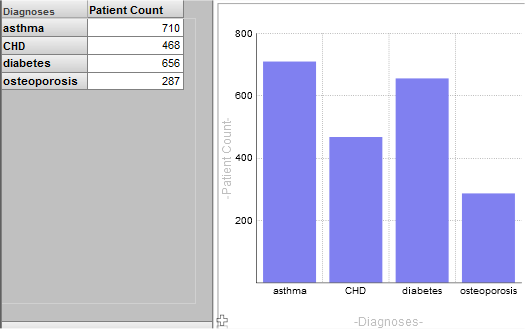
To display the results as a table and chart, click the Display As Table and Chart button  . For example:
To display the results as a table, click the Display As Table button  .
.
If you click the Chart Options button  , the Analyzer displays the following page:
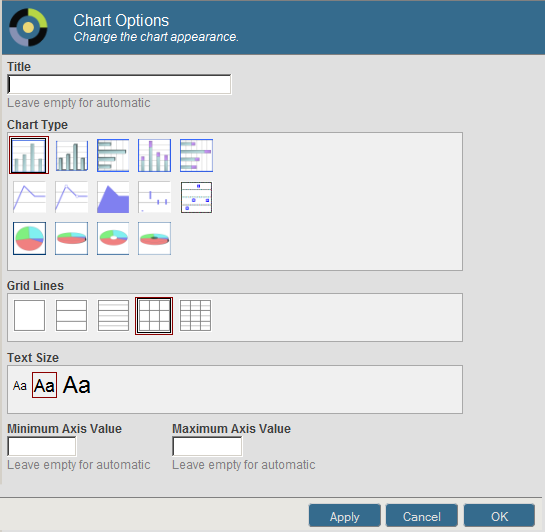
Here you can do the following:
-
Specify a new title. To do so, type a value into Title.
-
Specify a chart type. To do so, click the button in the Chart Type section.
-
Control the display of grid lines. To do so, click a button in the Grid Lines section.
-
Control the text size. To do so, click a button in the Text Size section.
-
Specify the minimum value to display on the vertical axis. To do so, type a value into Minimum Axis Value.
-
Specify the maximum value to display on the vertical axis. To do so, type a value into Maximum Axis Value.
Notes:
-
These changes do not affect the definition of the pivot table. When you add a pivot table to a dashboard, you can choose a chart type.
-
A chart displays only the first 100 items.
For information on the chart types, see “Available Chart Types” in the chapter “Adding Chart Widgets” in Creating DeepSee Dashboards.
Deleting a Pivot Table
To delete a pivot table in the Analyzer, click Delete.
When you delete a pivot table, DeepSee moves it into a folder named $TRASH. Or, if the pivot table is already in a folder, then $TRASH/ is prepended to the folder name. In either case, the pivot table is no longer visible in the web-based interfaces. If you have access to Studio, you can restore it. For details, see “Restoring Deleted Folder Items” in the chapter “Packaging DeepSee Elements into Classes” in the DeepSee Implementation Guide.