Information Needed for Troubleshooting
Information Needed for Troubleshooting
To identify the cause of a SOAP problem, you typically need the following information:
-
The WSDL and all external documents to which it refers.
-
(In the case of message-related problems) Some form of message logging or tracing. You have the following options:
Option Usable with SSL/TLS? Shows HTTP headers? Comments Caché SOAP log Yes No For security errors, this log shows more detail than is contained in the SOAP fault. CSP Gateway trace Yes Yes For problems with SOAP messages that use MTOM (MIME attachment), it is crucial to see HTTP headers. Third-party tracing tools No Depends on the tool Some tracing tools also show lower-level details such as the actual packets being sent, which can be critical when you are troubleshooting. These options are discussed in the following subsections.
It is also extremely useful to handle faults correctly so that you receive the best possible information. See the chapter “SOAP Fault Handling.”
Caché SOAP Log
To log the SOAP calls made to or from a Caché namespace, set the following nodes of the ^ISCSOAP global in that namespace:
| Node | Purpose |
|---|---|
| ^ISCSOAP("Log") | Specifies kind of logging. Use one of the following values (case-sensitive):
|
| ^ISCSOAP("LogFile") | Specifies the complete path and filename of the log file to create. |
The log indicates the sender or the recipient as appropriate, so that you can see which web service or client participated in the exchange.
The following shows a partial example of a log file with line breaks added for readability:
01/05/2010 13:27:02 *********************
Output from web client with SOAP action = http://www.mysecureapp.org/GSOAP.AddComplexSecureWS.Add
<?xml version="1.0" encoding="UTF-8" ?>
<SOAP-ENV:Envelope xmlns:SOAP-ENV='http://schemas.xmlsoap.org/soap/envelope/'
...
  <SOAP-ENV:Header>
      <Security xmlns="http://docs.oasis-open.org/wss/2004/01/oasis-200401-wss-wssecurity-secext-1.0.xsd">

  </SOAP-ENV:Header>
  <SOAP-ENV:Body>
...
   </SOAP-ENV:Body>
</SOAP-ENV:Envelope>


01/05/2010 13:27:33 *********************
Input to web client with SOAP action = http://www.mysecureapp.org/GSOAP.AddComplexSecureWS.Add

ERROR #6059: Unable to open TCP/IP socket to server localhost:8080
string
Note the following points:
-
With Caché XML tools, you can validate signatures of signed XML documents and decrypt encrypted XML documents. If you perform these tasks in this namespace, the log contains details for them as well. See Using Caché XML Tools.
-
The Caché SOAP log captures SOAP calls even when no message is sent on the wire (that is, when the service and client are both on a single machine).
-
If a severe error occurs, the system stops writing to the SOAP log. See the console log instead. For information, see “Monitoring Log Files” in the Caché Monitoring Guide.
HTTP Trace in the CSP Gateway
The CSP Web Gateway Management page enables you to trace HTTP requests sent to CSP pages (such as web services) and responses sent in return. See “Viewing HTTP Trace” in the CSP Gateway Configuration Guide.
Third-Party Tracing Tools
To test your web service, you can use tracing tools such as Wireshark, ProxyTrace, tcpTrace, XMLSpy, soapUI, or Web Service Studio Express. Some of these tools are free and others are licensed. Note that InterSystems does not make any specific recommendations about these tools; they are listed here for your general information.
Tracing tools enable you to see the actual method call, as well as the response. A tracing session listens on a certain port, shows you the messages it receives there, forwards those messages to a destination port, shows the responses, and forwards the responses to the listening port.
For example, suppose you have a Cache web service at http://localhost:57772/csp/gsop/GSOP.Divide.CLS
And suppose you have a Cache web client that you created to talk to that service. The web client has a LOCATION parameter equal to "http://localhost:57772/csp/gsop/GSOP.Divide.CLS"
To trace messages between the client and service, you need to do two things:
-
In the tracing tool, start a tracing session that listens on port 8080 (for example) and that uses the destination port 57772.
-
In the web client, edit the LOCATION parameter to use port 8080 instead of 57772. Then recompile.
Or, in your code that invokes the web client, change the Location property of the web client:
 //reset location to port 8080 to enable tracing
 set client.Location="http://localhost:8080/csp/gsop/GSOP.DivideWS.cls"
Now when you use the web client, the tracing tool intercepts and displays messages between the client and the web service, as shown in the following example:
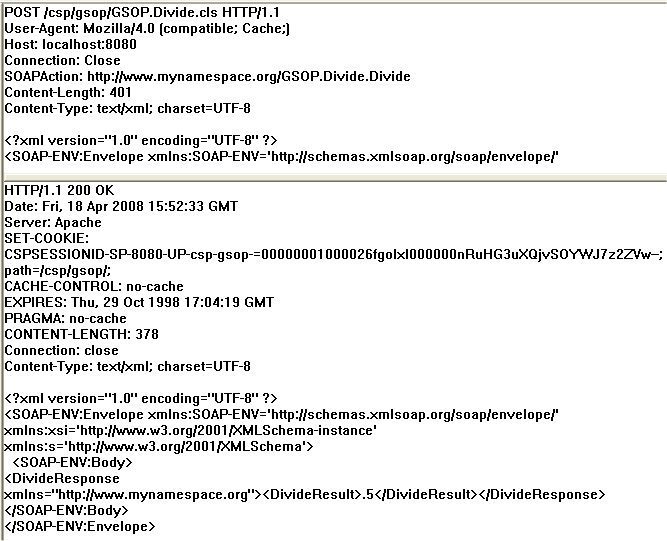
The top area shows the request sent by the client. The bottom area shows the response sent by the web service.