Running Zen Reports
This chapter explains how to run a Zen report from a browser or command line, with several variations. Topics include:
For diagnostic information, see the chapter, “Troubleshooting Zen Reports.”
Invoking Zen Reports from a Web Browser
A user can view reports in a browser by entering the URI of the Zen report .cls file. To specify the output format, the user either relies on the DEFAULTMODE class parameter in the Zen report class, or provides a $MODE parameter in the query string. The following examples illustrate the use of these parameters to generate an HTML report.
DEFAULTMODE in the Zen report class:
Parameter DEFAULTMODE = "html"
$MODE in the URI:
http://localhost:57772/csp/myPath/myApp.myReport.cls?$MODE=html
Where 57772 is the port number assigned to the Caché server. The report displays in HTML format.
Both DEFAULTMODE and $MODE share the following set of possible values:
-
displayxlsx — to generate a report as an Excel spreadsheet, using a ReportDisplay block to transform arbitrary XML into the format required for Excel generation.
-
excel — to generate a report as an Excel spreadsheet. See the section “Configuring Zen Reports for Excel Spreadsheet Output.”
-
fo2pdf — to render a report in PDF format directly from an FO file. This allows SVG to be stored in the database and then rendered as part of a PDF.
-
foandpdf — to first generate an FO file and then generate PDF from the FO file. Allows you to better store SVG in the database and retrieve it for display in the PDF.
-
html — to generate a report in HTML. This is the default.
-
pdf — to generate a report in PDF. You must first use the instructions in the section “Configuring Zen Reports for PDF Output.” Depending on your settings, the browser might first prompt you to save the file. If so, click Save to view the PDF.
-
pdfprint — to generate a report in PDF format and send it directly to a printer, without creating an intermediate file. You must first follow the instructions in the section “Configuring Zen Reports for PDF Output.”
Because pdfprint does not write output to disk, you cannot use it with the split and merge features of PDF output described in the section “Splitting and Merging PDF Output.” The Print Server is required to run pdfprint. See “The Print Server.”
-
ps — to generate a report in PDF format and send it directly to a PostScript printer.
-
tiff — to generate a report as a TIFF image file. You must install JAI Advanced Imaging I/O to do TIFF generation. TIFF generation is supported only through FOP not through RenderX. See “Configuring for TIFF Generation.”
-
xlsx — to generate a report as an Excel spreadsheet, using the xlsx format which is native to Office 2007 and Office 2010. This is the preferred mode for these versions of Office. See the section “Configuring Zen Reports for Excel Spreadsheet Output.”
-
xml — to view raw data for a report in XML format. Colorized XML displays in the browser.
Note that Chrome as it is installed by default does not display XML correctly, including Zen reports displayed with $MODE=xml. You need to install the XML Tree Chrome extension. Search for “XML Tree” at https://chrome.google.com/Opens in a new tab, or go directly to the following link:
https://chrome.google.com/extensions/detail/gbammbheopgpmaagmckhpjbfgdfkpadbOpens in a new tab
In addition, the following values are generally used in debugging. The section “Changing Output Mode to View Intermediate Files” provides additional information.
-
tohtml — to generate a to-HTML stylesheet in XSLT format.
-
toxslfo — to generate a to-XSLFO stylesheet in XSLT format.
-
xslfo — to display the XSL-FO file that is generated while producing PDF.
URI Query Parameters for Zen Reports
There are a number of URI query parameters available for use when invoking a Zen report class in a browser. You may use these parameters freely in Firefox, and with care in Internet Explorer. Problems might occur, especially in IE, but they can be overcome. If you run into trouble, see “Displaying XHTML with URI Query Parameters” in the chapter “Troubleshooting Zen Reports.”
The following table lists Zen report URI query parameters and their Zen report class parameter equivalents. You can find additional details about any parameter using the links provided in the table, or consult the section “Zen Report Class Parameters.” Note that by convention, the names of these parameters begin with dollar sign (“$”).
| URI Query Parameter | Class Parameter Equivalent | Description |
|---|---|---|
| $DATASOURCE | DATASOURCE | The URI of an XML document that contains the data for the Zen report. Relative URIs are handled with respect to the current URI. |
| $EMBEDXSL | EMBEDXSL | 1 (true) or 0 (false). When true, Zen reports generates XSLT instructions embedded within the output XHTML. When false, Zen reports generates a separate XSLT file. The default is 0 (false). |
| $LOG | — | 1 (true) or 0 (false). When true, use with $MODE=html or $MODE=pdf to view one of the intermediate files that Zen generates. |
| $MODE | DEFAULTMODE; also see STYLESHEETDEFAULTMODE |
Basic information about $MODE appears in the “Invoking Zen Reports from a Web Browser ” section. You may also use $MODE with the values that enable you to view intermediate files that are usually deleted. This use is described in the “Viewing Intermediate Files” section of the chapter “Troubleshooting Zen Reports.” |
| $NAMESPACEDECLARATIONS | NAMESPACEDECLARATIONS | Allows you to define namespace declarations. The namespace declarations are added to the root element of the generated XML and also to the stylesheet element of the generated XSL. |
| $NODELETE | — | 1 (true) or 0 (false). When true, save intermediate files to the general Caché temporary directory. |
| $PS | PS |
To send a report directly to a PostScript printer, without creating an intervening PDF file, use $MODE=ps in the URI string and set $PS to the location of the PostScript printer, such as:$PS=\\devD630\BrotherH You can also send the report directly to the printer by setting the DEFAULTMODE class parameter to "ps", and use the PS class parameter to set the PostScript printer location. |
| $REPORTNAME | — | The filename to use when saving intermediate files for diagnostic purposes. $REPORTNAME is not related to REPORTNAME. |
| $STRIPPI | — | 1 (true) or 0 (false). When true, strip the <?xml version="1.0"?> processing instruction from the top of the set of XML statements generated by this URI. For details, see the <get> section. |
| $USETEMPFILES | USETEMPFILES | 1 (true) or 0 (false). When true, save generated XSLT files in the CSP directory for your application. |
| $USEHTML5 | USEHTML5 | 1 (true), 0 (false), or "" (null). When null (the default), the report generates HTML5 only if the browser supports it. True and false force generation (non-generation) regardless of browser support. |
| $XSLT | XSLTMODE | "browser" or "server". Causes the XSLT to be processed, and output to be generated, on the browser or server, respectively. The default is "server". |
| $XSLTVERSION | XSLTVERSION | "1.0" or "2.0" causes XSLT for this report to be processed as XSLT 1.0 or XSLT 2.0, respectively. The default is "1.0". |
Setting Zen Report Class Properties from the URI
A Zen report class supports the data type parameter ZENURL. This parameter enables you to set Zen report class properties dynamically, from the URI string that you supply to the browser when you display a Zen report.
For example, suppose you define a property in a Zen report class as follows:
Property employeeID As %ZEN.Datatype.string(ZENURL="ID");When this Zen report is invoked by passing a URI string to a browser, any value specified for the ID query parameter is assigned to the class property employeeID. The following example assigns employeeID the value 48:
MyApp.MyPage.cls?ID=48
Internally, this causes the following code to run before the report is displayed:
Set %page.employeeID = $GET(%request.Data("ID",1))If the URI parameter assigned to a property does not pass the property’s validation test for any reason, such as a value greater than the property’s MAXVAL, Zen reports displays an error message instead of displaying the page.
If XSLT processing takes place on the server, there are no restrictions on your use of ZENURL. The class parameter XSLTMODE has a default value of “server”, which directs XSLT processing to take place on the server. You can set XSLTMODE to “browser”, or use the URI query parameter $XSLT=browser, to direct XSLT processing to the browser.
XSLT processing is done on the server regardless of the XSLTMODE setting if you have instructed Zen reports to generate the report as PDF with one of the following parameters:
-
URI query parameter $MODE is set to "pdf"
-
Class parameter DEFAULTMODE is set to "pdf" and $MODE does not override DEFAULTMODE
XSLT processing is done in the browser regardless of the XSLTMODE setting if you have instructed Zen reports to embed XSLT instructions with one of the following parameters:
-
URI query parameter $EMBEDXSL is set to 1
-
Class parameter EMBEDXSL is set to 1 and $EMBEDXSL does not override EMBEDXSL
In order to provide consistent behavior across browsers, Zen reports does not pass URI parameters in the generated XML in the xml-stylesheet processing instruction. Zen reports generates an xml-stylesheet processing instruction only when you are generating an HTML report on the browser and it is not embedding XSLT instructions in the generated HTML, which is the default behavior. For this reason, any code in the XData ReportDisplay block that relies on a property value passed as a ZENURL may produce unexpected results. The property has the initial value set with InitialExpression, if there is one, or it is null. This limitation is an especially important consideration any time you use %report in the ReportDisplay block to access report properties.
If you use %report in a way that relies on a property value passed as a ZENURL in the URI that invokes the report, you may see unexpected results if XSLT processing takes place in the browser.
Invoking Zen Reports from Zen Pages
To display a Zen report on a Zen page, place an <iframe> in the Zen page XData Contents block with the src value set to the Zen report class name. The Zen report class must exist in the same InterSystems namespace as the Zen class that contains the <iframe>.
For details about <iframe>, see the “Framed Content” section in the “Other Zen Components” chapter of Using Zen Components.
Environment Variables for Memory Configuration
The generation of PDF or Excel report output can be memory intensive. Zen reports provides several environment variables that allow you to configure the amount of memory available for these operations. The default value for all of these variables is 512mb. You can change the values of these environment variables to allocate more memory. These memory values change the -Xmx memory maximum value passed to the JVM.
-
EXCELMEMSIZE – memory available for generation of Zen reports as Excel spread sheets.
-
EXCELSERVERMEMSIZE – memory available to the Excel Server.
-
FOPMEMSIZE – memory available to the FOP PDF renderer.
-
RENDERSERVERMEMSIZE – memory available to the Render Server.
-
PRINTSERVERMEMSIZE – memory available to the Print Server.
-
SAXMEMSIZE – memory available to the SAX processor.
-
PDFMERGEMEMSIZE – memory available to the PDF merge operation.
Configuring Zen Reports for PDF Output
When you load a Zen report class into a browser with a request to view the output as PDF, Caché uses Java to call out to a third-party PDF rendering tool. The rendering tool applies the XSLT stylesheet to the XML data and transforms the XML into XSL-FO. Finally, the tool transforms the XSL-FO into PDF. For information on how to run a Zen report from the browser, see the section Invoking Zen Reports from a Web Browser.
The Caché installation provides a version of Apache FOP that Zen reports uses as the PDF rendering engine. You can also use another rendering engine, such as XEP PDF from RenderX, or download and install FOP from Apache.
Using the Built-in PDF Rendering Engine
The PDF rendering process works only if you have performed the required configuration steps. This section discusses configuration for the built-in FOP. For information on configuring alternate PDF renderers, see the section “Using Other Rendering Engines.”
-
If you do not already have a Java Virtual Machine (JVM) installed on the server, download and install this tool on your system. The JVM is included in the Java Runtime Environment (JRE) and the Java Developers Kit (JDK) version 7 (also known as version 1.7) or later, so if you have either of these tools you already have a JVM. Alternatively, you may install and use OpenJDK version 8.
In order for Caché to find Java, you need to define the JAVA_HOME environment variable and set it to the location where you have installed Java. JAVA_HOME is described in the Java documentation.
-
You must ensure that user privileges are set correctly, even if your Zen report does not use security features. To run a report with PDF output, the user must be logged into a user account that has the %System_CallOut:USE privilege.
If the Zen report is part of a Zen application, and you have enabled Unauthenticated access using the Allowed Authentication Methods field on the Web Applications page (System Administration > Security > Applications > Web Applications), the UnknownUser account must have the %System_CallOut:USE privilege.
To configure Zen application settings of all types, see the “Zen Application Configuration” section in the “Zen Applications” chapter of Developing Zen Applications. For information about privileges such as %System_CallOut:USE, see the “Assets and Resources” chapter in the Caché Security Administration Guide.
You can use the Zen reports class-parameter RESOURCE to impose additional privilege requirements.
-
If you are printing PDF directly via jPDFPrint, you need to define an environment variable that tells Zen reports the location of the jPDFPrint JAR file. On Windows, this variable is in the System Environment variables. For example, set the environment variable JPDFPRINT_HOME to c:\Program Files\jPDFPrint
-
You can create custom configuration files for the built-in FOP as described in materials on the Apache FOP Web site:
http://xmlgraphics.apache.org/fopOpens in a new tab
If you want the Caché callout to FOP to use a custom configuration file, you can set the global ^%SYS("zenreport","transformerconfig") to the path of the configuration file. Configuration files are important for adding fonts to FOP. You must first create font metrics, and then register them with FOP. The process is described on the Apache FOP Web site.
If you modify the FOP configuration file fop.xconf, then a Caché install does not copy over it. The FOP configuration file that comes with your Caché distribution is named fop.xconf_dist. If your fop.xconf file becomes corrupted for any reason (such as running RenderX, which truncates the file if the parameter USEINSTALLEDFOP is not set to zero), you can revert to the file as distributed with Caché by copying fop.xconf_dist to fop.xconf.
PDF rendering can consume a lot of memory. If you run into trouble, you might want to modify the FOP.bat or XEP.bat file to increase the amount of memory available to the Java Virtual Machine. The respective products provide documentation that explains how to do this.
Using Other Rendering Engines
A version of Apache FOP is installed with Caché. If you chose to use another PDF rendering tool, you must perform the following additional configuration steps.
-
Install the XSL-FO to PDF rendering tool. Two of the available options are:
-
An open source project from Apache called FOP. You can download it from the following Web site:
http://xmlgraphics.apache.org/fopOpens in a new tab
To install, simply extract the files from the kit.
-
The XEP product from RenderX. You can download a free trial version that produces a RenderX watermark on each output page, or you can buy the XEP product. See this Web site for details:
http://www.renderx.com/tools/xep.htmlOpens in a new tab
To install, follow the instructions in the kit.
-
To configure Zen Reports to work with RenderX XEP, you need to define a %JAVA_HOME% and a %XEP_HOME% environment variable. %JAVA_HOME% is described in the Java documentation. %XEP_HOME% is an environment variable specifying the location where you have installed XEP.
-
-
Configure Zen reports with the full pathname of the command file that invokes the rendering tool. For XEP or FOP on Windows or UNIX®, once you have installed the tool as instructed in Step 1, this command file is present on your system under the installation directory for the tool, for example C:\fop-0.95\fop.bat for Windows or /fop-0.95/fop on UNIX®.
You can configure Zen reports from the Management Portal Zen Report Settings page (System Administration > Configuration > Zen Report Settings) as follows:
-
Path and File Name For PDF Generation: — Enter the path to the executable file. Click Browse to locate and select the command file.
-
Foxit / Adobe Path for Pdfprint: — Ignore this field.
-
Configuration File For PDF Rendering Engine: — This field is optional. Select Use or None. If you select Use, enter the path to the FOP configuration file. If you do not specify a FOP configuration file, the FOP renderer uses the configuration file supplied with the built-in FOP.
Do not enter a path in this field if you are using an XEP renderer. The XEP renderer truncates any file specified here to 0 length. Click Browse to locate and select the configuration file.
You can create custom configuration files as described by the tool provider’s Web site. To provide XEP with a custom configuration file, you need to follow the manual for XEP.
-
Default HotJVM Render Server Port — Enter the port number where the HotJVM Render Server is running. If you specify a port number, all Zen reports use the HotJVM running on this port.
-
Verify Now — Click this button to test whether or not the rendering tool is configured correctly.
Alternatively, you can enter commands to set the corresponding Caché global at the Terminal prompt. For example, to set the renderer executable:
Set ^%SYS("zenreport","transformerpath")="/Applications/fop-0.95/fop.bat"Similarly, to set the configuration file, set ^%SYS("zenreport","transformerconfig") to the path of the configuration file.
-
-
The default behavior of the Zen reports system is to use the installed FOP to render reports if you have not set an alternative renderer on the Management Portal Zen Report Settings page (System Administration > Configuration > Zen Reports > Settings). If you want Zen reports to generate an error if you have not specified a renderer, set the class-parameter USEINSTALLEDFOP to 0 from its default value of 1 in each Zen report, or in the Zen report's Application. To apply this change to all Zen reports at once, you can set the parameter in the default Application for Zen reports: %ZEN.Report.defaultApplicationOpens in a new tab.
-
For FOP version 0.94 or earlier
If you are using FOP version 0.94 or earlier, you must set a flag to tell Zen reports that an older FOP version is the rendering tool. To do this, enter the following commands at the Terminal prompt:
 ZN "%SYS"
 SET ^%SYS("zenreport","oldfop")=1
Even with this measure in place, the following elements do not support percentage widths when FOP 0.94 or earlier is the rendering engine: <block> <caption> <img> and <p>. For alternate syntax that you can use to specify widths for these elements, or for any other Zen report display elements, see “Dimension and Size” in the chapter “Formatting Zen Report Pages”
-
For rendering engines other than XEP or FOP
Usually the choice of PDF rendering engine is XEP or FOP, each of which supports the same set of command line options for the transformation from XSL-FO to PDF. If you have completed the previous steps in this list, no further configuration work is necessary to make the XEP or FOP engines work with Zen reports.
If you want Zen reports to use a PDF rendering engine other than XEP or FOP, this engine might require different command line options when it is invoked. In this case, you must specify the correct option syntax using class parameters in your Zen report class.
The following table lists each relevant class parameter and describes the value it must have to use Zen reports with various PDF rendering engines. If the engine you are using is not listed here, check its documentation to verify which values you should use for these parameters.
Class Parameter This Command Line Option Identifies the... Zen Reports Default Value XEP Value FOP Value Antenna House XSL Formatter Value PDFSWITCH PDF output file -pdf -pdf -pdf -o XMLSWITCH XSL-FO data file -xml -xml -xml -d XSLSWITCH XSL-FO stylesheet file -xsl -xsl -xsl -s For details, see “Class Parameters for General Use” in the appendix “Zen Report Class Parameters.”
Splitting and Merging PDF Output
The PDF output for a very large report may exceed the memory restrictions of the FOP rendering engine. In this case, you can split the report into several smaller sections. Each section is written to disk as a separate temporary file, and merged into a single PDF file once the entire report has been processed. You need to set the following parameters in your report:
-
SPLITANDMERGE: Set this parameter to true, to generate multiple intermediate files. The default value is false.
-
REPEATINGELEMENT: Specifies the report element in the generated XML on which to divide the report. This element must be a direct child of the root element in the XML generated by the report.
-
COUNTREPEATINGELEMENT: Specifies the number of the repeating elements set in REPEATINGELEMENT to put in each of the intermediate files. The default value is 100, but that could be too high if the report output for each repeating element is large.
Computed page counts may not be valid in the merged report because there is no logic in the merge process to recalculate or change page counting. Any <masterreference> elements defined for specialized formatting of first or last pages are applied to each split section independently. Also be aware that elements that are not contained within a repeating element, such as final aggregates, may not appear in the final report.
Each of the parameters described previously has a corresponding property that you can also use to split and merge reports. The following example illustrates setting these properties when using GenerateReport to split and merge a report at the Caché terminal.
 zn "SAMPLES"
 do ##class(ZENDemo.Home).CreateDemoData()
 s rpt1=##class(ZENApp.MyReport).%New()
 s rpt1.RepeatingElement="SalesRep"
 s rpt1.CountRepeatingElement=5
 s rpt1.SplitAndMerge=1
 s rpt1.Month=1
 s Status=rpt1.GenerateReport("c:\temp\MyReport1.pdf",0)
 d $System.Status.DisplayError(Status)
 w $System.Status.DisplayError(Status)
You can also set these parameters in the URL of the report by appending a $ in front of the symbol name: $SPLITANDMERGE, $REPEATINGELEMENT and $COUNTREPEAINGELEMENT.
The following sample URI illustrates passing these parameters in the URL. It contains a line break for typesetting purposes only; a correct URI is all on one line.
http://localhost:57772/csp//samples/ZENApp.MyReport.cls
?$MODE=pdf&$SPLITANDMERGE=1&$REPEATINGELEMENT=SalesRep
&$COUNTREPEATINGELEMENT=5
You can also use SPLITANDMERGE to generate a report as several PDF files. You would use this approach in a situation such as a billing application where you need to generate an individual PDF file for each customer bill from a large master XML file. You must set the three parameters described previously, and in addition, you must set the property SplitOnly to true. The default value is false. When SplitOnly is true, the PDF files are generated and written to disk, but they are not merged at the end. The names of the individual PDF files are returned in the property %SplitReturnedPDFs. There may be situations, such as debugging, in which you want to specify the directory and filename of the generated PDF files. The property SplitDir specifies the directory, and SplitRootName specifies the root name for the generated files, to which a sequential integer is appended for each file.
The HotJVM Render Server
Zen reports provides HotJVM Render Server capability to improve PDF rendering performance. The HotJVM Render Server is a Java Virtual Machine process which runs in the background and renders Zen reports as PDF files. By running as a background process, HotJVM eliminates the overhead of starting the Java Virtual Machine, and allows faster PDF rendering.
The Management Portal Render Servers page (System Administration > Configuration > Zen Reports > Render Servers) lists currently configured Render Servers. When Caché is first installed, there are no Render Servers configured. Because the Render Server consumes system memory, you should not configure and run a Render Server unless you need the improved rendering performance. If you have configured a Render Server, it starts automatically when you try to generate a report using the Render Server port.
Creating a HotJVM Render Server
The New Render Server button opens the New Zen Report Render Server page, which lets you configure a new Render Server. The first three fields are required, the remaining fields are optional.
-
Name: A unique name for the Render Server.
-
Port: The TCP port that the Render Server uses to receive reports to render.
-
Ping Port: The TCP port that the Render Server uses for all other communication, such as status queries and shutdown requests.
-
Num Threads: If the Render Server is using multi-threaded Java, this field supplies the number of threads used by the Render Server for report rendering.
-
Num Ping Threads: If the Render Server is using multi-threaded Java, this field supplies the number of threads used by the Render Server for other communication.
-
PDF Renderer: The renderer used by the Render Server for PDF rendering of Zen reports. The value FOP is the default and refers to the version of Apache FOP that is installed with Caché. If you select RenderX XEP, you must specify the location of the configuration file, xep.xml by providing an XEP_HOME environment variable.
-
Renderer Configuration File: A file that contains configuration information for the built-in FOP renderer. This field is automatically filled with the name of the default file, C:\MyCache\fop\conf\fop.xconf. This file is supplied with the built-in FOP. You can use it as a template for a custom file. The file C:\MyCache\fop\conf\fop.xconf_dist is a backup copy. If you want to use a different configuration file, provide the file name here.
This field does not appear on the form if you select the RenderX XEP PDF renderer. You must use the XEP_HOME environment variable to specify the location of the xep.xml, the RenderX XEP configuration file.
-
Log Level: Standard Java parameters to control logging. If you choose to enable logging, the following three items appear on the form:
-
Log File: By default, the Render Server log file is created in your home directory. You can specify an alternate location here. On Unix systems, in order to avoid privilege issues, specify a location where the user has appropriate permissions.
Each time you stop and restart the Render Server, it begins a new log file. The Render Server also starts a new log file when the file size exceeds the limit set by Max. File Size. The log file names have a numeric suffix. The file ending in .0 is the most recent, and as new files are created, the previous ones are renamed with larger suffix numbers, until the number of files reaches the limit set by Rotation Count. Then the names recycled and older information is lost. This field supplies the path and base file name of the log file.
If you configure more than one Render Server, providing log file names makes it easy for you to match log files with the Render Server that created them.
-
Max. File Size: Maximum size of the Render Server log file. The Render Server creates a new log file when the size of the current log file reaches this limit.
-
Rotation Count: The maximum number of log files. The Render Server recycles file names, losing older information, when the number of log files reaches this limit.
-
-
Initialization Timeout: The amount of time in seconds that Zen reports waits for the Render Server to start up. An error occurs if the Render Server fails to start in this time.
-
Connection Timeout: The amount of time in seconds that Zen reports waits for the Render Server to connect when rendering a report. You normally expect connection to take less time than initialization. An error occurs if the Render Server fails to connect in this time.
-
Initial Queue Size: The initial size of rendering queue.
-
Memory Threshold: The number of bytes that define the memory usage threshold. For example, 1,000,000 means one million bytes. You cannot use short cut notation such as 1000K to mean a million bytes.
-
Threshold Polling Period (ms): The number of milliseconds to wait before polling the memory threshold.
For additional information on Initial Queue Size, Memory Threshold, and Threshold Polling Period (ms) see Memory Management for the HotJVM Render Server.
If you configure a Render Server to use RenderX XEP, additional fields appear on the configuration page:
-
How Often To Clean (XEP): The interval in seconds the RenderServer uses to check whether RenderX has processed enough files to require cleaning. The default value is 300 seconds (5 minutes).
-
Num. Files Before Clean (XEP): The number of files RenderX can process before the Render Server initiates a cleaning operation. The default value is 100.
-
XEP_HOME Environment Variable: The path to the XEP installation directory.
RenderX can consume memory as it runs, so a cleaning operation needs to be performed periodically. Cleaning also consumes resources, so fields are provided to let you set the parameters that determine when cleaning takes place. The need for cleaning is determined by the number of files RenderX has processed. Use the field Num. Files Before Clean (XEP) to set this number. The value set in How Often To Clean (XEP) determines how often the Render Server checks whether RenderX has reached the file limit.
Once you have saved your changes, use the Cancel button to return to the Render Servers page, where you see that the new Render Server has been added to the list.
Using a HotJVM Render Server
The Manage button, which is located to the right of each listing on the Render Servers page (System Administration > Configuration > Zen Reports > Render Servers), lets you edit values and perform additional tasks:
-
Delete: Removes the Render Server. You cannot edit or delete a Render Server while it is running.
-
Start: Starts the Render Server. Asks for confirmation and provides some information on its status. Note that the Render Server starts automatically when you generate a report using the Render Server port.
-
Stop: Stops the Render Server. Asks for confirmation and provides some information on its status.
-
Verify: Checks status of ports assigned to the Render Server. You expect the ports to be in use if the Render Server is running, and not in use if it is not.
-
Activity: Summarizes activity on this server since the last shutdown.
-
Log: Opens the log file.
In your Zen report you can set the RENDERSERVER class parameter to the port the Render Server is listening on. Then load the page with the mode set to PDF. You can also set RENDERSERVER class parameter for an entire Zen Application. Another alternative is to pass the port number in the URL using the reserved keyword $RENDERSERVER. You can also use this keyword to run a report on the server from the command line to generate a report into a user defined output file like the sample outlined below:
 zn "SAMPLES"
 set rpt1=##class(ZENApp.MyReport).%New()
 set rpt1.Month=1
 set Status=rpt1.GenerateReport("c:\temp\MyReport.pdf",2,0,57777)
 do $System.Status.DisplayError(Status)
The fourth parameter to GenerateReport gives the port of the HotJVM rendering server.
The Zen report property RenderTimeOut controls the length of time the report waits for the Render Server before timing out. A positive integer specifies the number of seconds to wait before timing out. A value of 0 means timeout immediately, and a value of –1 means never timeout. You can also pass the timeout interval in the URL using $RENDERTIMEOUT. The default value is null ("" in Caché), which means never timeout.
Communicating with the HotJVM Render Server
The class %ZEN.Report.PingOpens in a new tab provides the ping method that you can use to communicate with the HotJVM Render Server.
In addition to the port and server type, ping returns the maximum memory available, the committed memory, and the amount of memory used. The Render Server attempts to use the Java tenured generation pool to get information about memory and return this information to ping. If the Render Server cannot find the Java tenured generation pool, it returns a blank string ("") for the value of maximum memory and used memory.
The ping method also returns the runtime name in the form pid@hostname. You can use $PIECE to process the string and get the process id.
The following example shows how to use ping:
 set Status=##class(%ZEN.Report.Ping).ping("1234",30,.port,.servertype,.memMax,.memCommitted,.memUse,.runtimeName)
 write !,"port="_port
 write !,"servertype="_servertype
 write !,"memMax="_memMax
 write !,"memCommitted="_memCommitted
 write !,"memUse="_memUse
 write !,"runtimeName="_runtimeName
Memory Management for the HotJVM Render Server
PDF rendering can be very memory intensive, especially if you are producing very large reports. If the rendering engine exhausts available physical memory, degraded performance and out of memory errors result. The most robust solution to out of memory errors is to put enough physical memory on the machine running the Render Server so that out of memory errors do not occur. The book Java Performance by Charlie Hunt and Binu John describes how to set up the JVM so that it logs out of memory errors. You can then test the system with what you anticipate to be a maximum load, and use the log to determine when out of memory errors occur. Add additional memory until the machine has enough memory to render all reports.
Zen reports has features that help to manage memory usage during report rendering. The first is a queuing discipline on the Render Server. Instead of directly processing rendering requests, the Render Server stores them in a queue. The Render Server queue gates rendering in the following manner:
-
A report enters the queue.
-
If the queue size is less than the initial queue size, render the report.
-
If the queue size is greater than the initial queue size, hold the report in the queue.
-
A thread renders a report in the queue.
-
The thread is removed from the queue, decreasing queue size.
Using a queuing size allows you to decrease the number of reports sent to threads and queue up rendering requests until a thread is available to process the request. The field Initial Queue Size on the Render Servers page (System Administration > Configuration > Zen Reports > Render Servers) lets you set the maximum size of the queue. The default value for the queue size is the number of Render threads, and you usually set it to a value less than or equal to the number of threads. A smaller queue size means that fewer reports are rendered simultaneously. You must determine the optimal queue size by benchmarking. Making the number of threads greater than the number of cores or processors probably results in little performance gain. Note that having a finite number of threads already causes queuing when there are more requests to render that arrive at the Render Server than there are available threads to perform rendering.
The Render Server queueing discipline helps prevent out of memory caused by trying to render too many reports at once but cannot solve all memory use problems, because you can still send a single report to the Render Server, which is large enough to cause out of memory errors.
An additional memory management feature allows you to define a threshold size for the tenured generation pool. When the Render Server receives a rendering request and the threshold size is exceeded the Render Server sleeps for the specified number of milliseconds. The Render Server polls the size of the tenured generation pool until memory usage is below the threshold size then performs the requested rendering. This algorithm allows the Render Server to adapt to low memory conditions by delaying rendering until used memory falls below a threshold you have set. The field Memory Threshold on the Render Servers page (System Administration > Configuration > Zen Reports > Render Servers) lets you set the memory threshold. For information on setting the Memory Threshold and other memory management parameters through the Management Portal, see Creating a HotJVM Render Server.
The Render Server does a System.exit(1) whenever it encounters an out of memory condition. This allows the Render Server to behave more deterministically when out of memory conditions occur.
The Print Server
Zen reports provides Print Server capability to improve PDF printing performance. The Print Server is a Java Virtual Machine process which runs in the background and prints Zen report PDF files.
The Management Portal Print Servers page (System Administration > Configuration > Zen Reports > Print Servers) lists currently configured Print Servers. When Caché is first installed, there are no Print Servers configured. If you have configured a Print Server, it starts automatically when you try to print a report using the Print Server port.
In addition to using the instructions here, make sure that the user under whose name the Caché instance is running has adequate permissions to access the printer.
Creating a Print Server
The New Print Server button opens the New Zen Report Print Server page, which lets you configure a new Print Server. The first three fields are required, the remaining fields are optional.
-
Name: A unique name for the Print Server.
-
Port: The TCP port that the Print Server uses to receive reports to print.
-
Ping Port: The TCP port that the Print Server uses for all other communication, such as status queries and shutdown requests.
-
Num Threads: If the Print Server is using multi-threaded Java, this field supplies the number of threads used by the Print Server for report rendering.
-
Num Ping Threads: If the Print Server is using multi-threaded Java, this field supplies the number of threads used by the Print Server for other communication.
-
Print Engine: The print engine used by the Print Server for printing Zen reports. Select jPDFPrint from Qoppa Software. See “Print Engine”.
-
Key: The license key provided when you purchased Qoppa jPDFPrint.
-
Log Level: Standard Java parameters to control logging. If you choose to enable logging, the following three items appear on the form:
-
Log File: By default, the Print Server log file is created in your home directory. You can specify an alternate location here. On Unix systems, in order to avoid privilege issues, specify a location where the user has appropriate permissions.
Each time you stop and restart the Print Server, it begins a new log file. The Print Server also starts a new log file when the file size exceeds the limit set by Max. File Size. The log file names have a numeric suffix. The file ending in .0 is the most recent, and as new files are created, the previous ones are renamed with larger suffix numbers, until the number of files reaches the limit set by Rotation Count. Then the names recycled and older information is lost. This field supplies the path and base file name of the log file.
If you configure more than one Print Server, providing log file names makes it easy for you to match log files with the Print Server that created them.
-
Max. File Size: Maximum size of the Print Server log file. The Print Server creates a new log file when the size of the current log file reaches this limit.
-
Rotation Count: The maximum number of log files. The Print Server recycles file names, losing older information, when the number of log files reaches this limit.
-
-
Initialization Timeout: The amount of time in seconds that Zen reports waits for the Print Server to start up. An error occurs if the Print Server fails to start in this time.
-
Connection Timeout: The amount of time in seconds that Zen reports waits for the Print Server to connect when printing a report. You normally expect connection to take less time than initialization. An error occurs if the Print Server fails to connect in this time.
Use the save button to save your changes, or the Cancel button to return to the Zen Report Print Servers page. Once you have saved your changes, you see that the new Print Server has been added to the list.
Print Engine
The Print Server print engine available is jPDFPrint from Qoppa Software.
When you use jPDFPrint, you need to define an environment variable that shows the location of the jPDFPrint JAR file. On Windows, this variable is in the System Environment variables. For example, set the environment variable JPDFPRINT_HOME to c:\Program Files\jPDFPrint
Managing the Print Server
The Manage button, which is located to the right of each listing on the Print Servers page (System Administration > Configuration > Zen Reports > Print Servers), lets you edit values and perform additional tasks:
-
Delete: Removes the Print Server. You cannot edit or delete a Print Server while it is running.
-
Start: Starts the Print Server. Asks for confirmation and provides some information on its status. Note that the Print Server starts automatically when you generate a report using the Print Server port.
-
Stop: Stops the Print Server. Asks for confirmation and provides some information on its status.
-
Verify: Checks status of ports assigned to the Print Server. You expect the ports to be in use if the Print Server is running, and not in use if it is not.
-
Activity: Summarizes activity on this Print Server since the last shutdown.
-
Log: Opens the log file. Maximum file size displayed in the browser is 1 megabyte, and files larger than this limit are truncated.
In your Zen report you can set the PRINTSERVER class parameter to the port the Print Server is listening on. Then load the page with the mode set to pdfprint. You can also set PRINTSERVER class parameter for an entire Zen Application.
The Zen report property PrintTimeOut controls the length of time the report waits for the Print Server before timing out. A positive integer specifies the number of seconds to wait before timing out. A value of 0 means timeout immediately, and a value of –1 means never timeout. You can also pass the timeout interval in the URL using $PRINTTIMEOUT. The default value is null ("" in Caché), which means never timeout.
Communicating with the Print Server
The class %ZEN.Report.PingOpens in a new tab provides the ping method that you can use to communicate with the Print Server.
In addition to the port and server type, ping returns the maximum memory available, the committed memory, and the amount of memory used. The Print Server attempts to use the Java tenured generation pool to get information about memory and return this information to ping. If the Print Server cannot find the Java tenured generation pool, it returns a blank string ("") for the value of maximum memory and used memory.
The ping method also returns the runtime name in the form pid@hostname. You can use $PIECE to process the string and get the process id.
The following example shows how to use ping:
 set Status=##class(%ZEN.Report.Ping).ping("1234",30,.port,.servertype,.memMax,.memCommitted,.memUse,.runtimeName)
 write !,"port="_port
 write !,"servertype="_servertype
 write !,"memMax="_memMax
 write !,"memCommitted="_memCommitted
 write !,"memUse="_memUse
 write !,"runtimeName="_runtimeName
Configuring Zen Reports for Excel Spreadsheet Output
You can use Zen reports to generate an Excel spreadsheet from data in a Caché database. You need to instruct Zen reports to generate an Excel spreadsheet by setting the parameter DEFAULTMODE to "excel", or setting the URI query parameter $MODE=excel. You must have Excel 2003 or later installed on your computer, or have a plugin or program registered to read the Microsoft XML file format for Office 2003. You must also have a Java Virtual Machine (JVM) and Java Developers Kit (JDK) version 1.7 or later installed.
If you are using Office 2007 or Office 2010, you should set DEFAULTMODE to "xlsx", or set the URI query parameter $MODE=xlsx. This value instructs Zen reports to generate a spreadsheet using the Excel xlsx format, which is native to Office 2007 and Office 2010.
Even though you are not using the ReportDisplay block for report output, it must be defined, and the name attribute must be identical to the name attribute in the ReportDefinition.
In order to generate an Excel spread sheet, the ReportDefinition block must have a very specific structure. Zen reports uses elements in the ReportDefinition to generate XML, then uses that XML to generate the Excel spread sheet. The following figure shows how elements in the ReportDefinition map to components of the Excel spread sheet. Following sections illustrate this process in more detail.
Starting with Caché version 2015.1, Zen reports supports setting DEFAULTMODE to "displayxlsx". This mode enables you to use the ReportDisplay block to convert the output of an arbitrary ReportDefinition block into XML appropriate to generate an Excel spread sheet. See Generating Excel Spread Sheets from Arbitrary XML.
The following list summarizes the available modes for Excel spread sheet generation:
-
excel – for Excel 2003 or later, but prior to Office 2007 and Office 2010.
-
xlsx – for Office 2007 and Office 2010.
-
displayxlsx – for Office 2007 and Office 2010 when the ReportDefinition output is not in the required format.
Including Data in the Spreadsheet
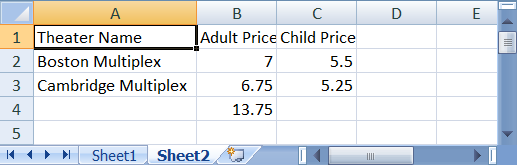
By default, only data in <element> elements is used in the spreadsheet. The following <report> block uses <element> for TheaterName and AdultPrice, but <attribute> for ChildPrice:
<report xmlns="http://www.intersystems.com/zen/report/definition"
    name="ReportExample"
    sql="Select Top 2 TheaterName, AdultPrice, ChildPrice from Cinema.Theater">
  <group name="Theater">
   <element name="TheaterName" field="TheaterName" />
   <element name="AdultPrice" field="AdultPrice" />
   <attribute name="ChildPrice" field="ChildPrice" />
  </group>
 </report>
It generates the following XML:
<ReportExample>
  <Theater ChildPrice="5.75">
    <TheaterName>General Cinema Cambridge</TheaterName>
    <AdultPrice>7.25</AdultPrice>
  </Theater>
  <Theater ChildPrice="4.75">
     <TheaterName>Boston Multiplex</TheaterName>
    <AdultPrice>6.25</AdultPrice>
  </Theater>
</ReportExample>
Which produces the following Excel spreadsheet. Note that only values from <element> elements appear in the spreadsheet.
The class parameter EXCELMODE determines whether values in the spreadsheet come from <element> or <attribute> elements. The default value is "element". If you set EXCELMODE = "attribute", this <report> block:
<report
 xmlns="http://www.intersystems.com/zen/report/definition"
 name="ReportExample"
 sql="Select Top 10 TheaterName, AdultPrice, ChildPrice from Cinema.Theater">
  <group name="Theater">
    <attribute name="TheaterName" field="TheaterName" />
    <element name="AdultPrice" field="AdultPrice" />
    <attribute name="ChildPrice" field="ChildPrice" />
  </group>
</report>
Generates the following XML:
<ReportExample>
  <Theater TheaterName="General Cinema Cambridge" ChildPrice="5.75">
    <AdultPrice>7.25</AdultPrice>
  </Theater>
  <Theater TheaterName="Boston Multiplex" ChildPrice="4.75">
    <AdultPrice>6.25</AdultPrice>
  </Theater>
</ReportExample>
Which produces the following Excel spreadsheet. Note that only values from <attribute> elements appear in the spreadsheet.
Use of EXCELMODE = "attribute" is not recommended, because it is inflexible and unable to carry Excel metadata. For instance, because you cannot specify isExcelNumber or isExcelDate on an attribute, all data is treated as text. This can cause aggregates to malfunction if Excel is attempting to perform arithmetic operations on text. In addition, under some circumstances, columns appear in the spreadsheet in attribute name alphabetical order, rather than in the order specified in the report. This can lead to a mismatch with aggregates if the aggregates are not organized in the same alphabetical order as the attributes. The relevant circumstances are:
-
If mode = "excel" and EXCELMULTISHEET is its default value of 0, then EXCELMODE = "attribute" produces columns from attributes in the order specified in the XML, not alphabetically.
-
If mode = "xlsx" or EXCELMULTISHEET is 1, then EXCELMODE = "attribute" produces columns from attributes in attribute name alphabetical order.
Numbers, Dates and Aggregates
In the examples provided in the previous section, numeric values are interpreted as text in both Excel spreadsheets. Zen reports also enables you to instruct Excel to interpret a value as a number, date, or time. This feature is available only when EXCELMODE = "element".
Zen reports supports number, date and time values in Excel spreadsheets in two ways, depending on whether you are generating the spreadsheet in excel (Excel 2003) or xlsx (Excel 2007 and 2010) mode. In excel mode, You can use isExcelNumber, isExcelDate or isExcelTime to specify that the value supplied by an <element> should be treated as a number, date or time in the spreadsheet. For spreadsheets generated in xlsx mode, Zen reports also lets you provide additional formatting information with excelNumberFormat.
If the runtimeMode of the group that contains the time element is 1 (ODBC) or 2 (display), the time expression needs to be in display format, for example $ztime($P($h,",",2)). If the runtimeMode is 0 (logical), the time expressions needs to be in logical format, for example, $P($h,",",2).
The supported number, date and time formats used with excelNumberFormat are taken from the ISO standard that defines the Microsoft Excel file format, as described in the document c051463_ISOIEC 29500-1_2008(E).pdf. You can find this document at:
http://standards.iso.org/ittf/PubliclyAvailableStandards/index.htmlOpens in a new tab
Search for 29500, part 1.
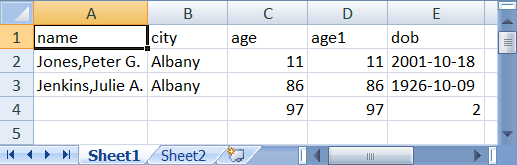
The following example produces a spreadsheet in excel mode that contains numbers, dates, and times.
<report xmlns="http://www.intersystems.com/zen/report/definition"
 name="MyReport" runonce="true" >
 <group name="Persons"
  sql="SELECT top 5 name,Home_City as city,age,dob from Sample.Person
  order by Home_City" runtimeMode="1"
  excelSheetName="Sample People" >
  <group name="Person" >
   <element field="age" name="age" excelName="Age"
    isExcelNumber="true"/>
   <element field="dob" name="dob" excelName="Date of Birth"
    isExcelDate="true"/>
   <element name="time"
    expression='$ztime($P($h,",",2))' excelName="Time"
    isExcelTime="true"/>
  </group>
 </group>
</report>
It produces the following output in Excel:
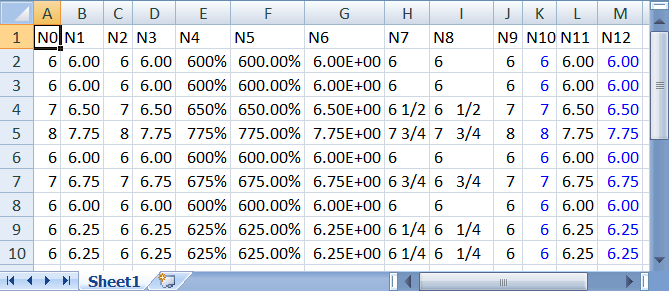
The next example illustrates several number formats supported in xlsx mode:
<report xmlns="http://www.intersystems.com/zen/report/definition"
 name="MyReport" runonce="true" >
 <group name="Cinemas"
  sql="SELECT top 10 TheaterName,AdultPrice,ChildPrice from
  Cinema.Theater order by TheaterName" >
  <group name="Cinema">
   <element field="AdultPrice" excelName="N0"
    isExcelNumber="true" excelNumberFormat="0"/>
   <element field="AdultPrice" excelName="N1"
    isExcelNumber="true" excelNumberFormat="0.00"/>
   <element field="AdultPrice" excelName="N2"
    isExcelNumber="true" excelNumberFormat="#,##0"/>
   <element field="AdultPrice" excelName="N3"
    isExcelNumber="true" excelNumberFormat="#,##0.00"/>
   <element field="AdultPrice" excelName="N4"
    isExcelNumber="true" excelNumberFormat="0%"/>
   <element field="AdultPrice" excelName="N5"
    isExcelNumber="true" excelNumberFormat="0.00%"/>
   <element field="AdultPrice" excelName="N6"
    isExcelNumber="true" excelNumberFormat="0.00E+00"/>
   <element field="AdultPrice" excelName="N7"
    isExcelNumber="true" excelNumberFormat="# ?/?"/>
   <element field="AdultPrice" excelName="N8"
    isExcelNumber="true" excelNumberFormat="# ??/??"/>
   <element field="AdultPrice" excelName="N9"
    isExcelNumber="true" excelNumberFormat="#,##0 ;(#,##0)"/>
   <element field="AdultPrice" excelName="N10"
    isExcelNumber="true" excelNumberFormat="[Blue]#,##0 ;[Red](#,##0)"/>
   <element field="AdultPrice" excelName="N11"
    isExcelNumber="true" excelNumberFormat="#,##0.00;(#,##0.00)"/>
   <element field="AdultPrice" excelName="N12"
    isExcelNumber="true" excelNumberFormat="[Blue]#,##0.00;[Red](#,##0.00)"/>
  </group>
 </group>
</report>
It produces the following output:
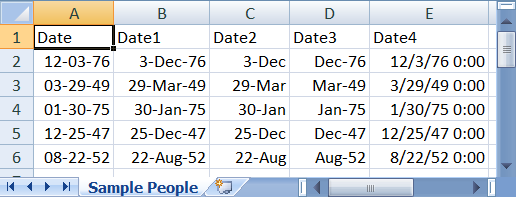
The following example shows several different date formats supported in xlsx mode.
<report xmlns="http://www.intersystems.com/zen/report/definition"
 name="MyReport" runonce="true" >
 <group name="Persons"
  sql="SELECT top 5 name,Home_City as city,age,dob from Sample.Person"
  runtimeMode="1" excelSheetName="Sample People" >
  <group name="Person" >
   <element field="dob" excelName="Date"
    isExcelDate="true" excelNumberFormat="mm-dd-yy"/>
   <element field="dob" excelName="Date1"
    isExcelDate="true" excelNumberFormat="d-mmm-yy"/>
   <element field="dob" excelName="Date2"
    isExcelDate="true" excelNumberFormat="d-mmm"/>
   <element field="dob" excelName="Date3"
    isExcelDate="true" excelNumberFormat="mmm-yy"/>
   <element field="dob" excelName="Date4"
    isExcelDate="true" excelNumberFormat="m/d/yy h:mm"/>
  </group>
 </group>
</report>
It produces the following output in Excel:
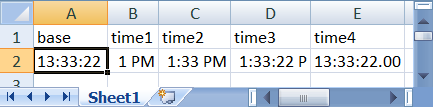
The following example shows several different time formats supported in xlsx mode.
<report xmlns="http://www.intersystems.com/zen/report/definition"
 name="MyReport" runonce="true">
 <group name="Time">
  <group name="TimeFormats">
   <element name="base" expression='$ztime($P($h,",",2))'/>
   <element name="time1" expression='$ztime($P($h,",",2))'
       isExcelTime="true" excelNumberFormat="h AM/PM" />
   <element name="time2" expression='$ztime($P($h,",",2))'
       isExcelTime="true" excelNumberFormat="h:mm AM/PM" />
   <element name="time3" expression='$ztime($P($h,",",2))'
       isExcelTime="true" excelNumberFormat="h:mm:ss A/P" />
   <element name="time4" expression='$ztime($P($h,",",2))'
       isExcelTime="true" excelNumberFormat="h:mm:ss.00" />
  </group>
 </group>
</report>
It produces the following output in Excel:
Aggregates
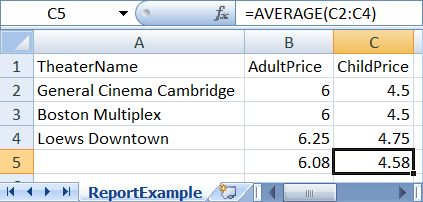
If you set the class parameter AGGREGATETAG, you can also add aggregates to the spreadsheet. A popular value for AGGREGATETAG is "aggregate", but you can use any value that is a valid name for an XML attribute. The value of AGGREGATETAG is used to create an attribute in the generated XML that identifies items as coming from an <aggregate> element in the report. The attribute excelFormula specifies that the value supplied by this aggregate should be an Excel formula in the spreadsheet. excelFormula must be an Excel formula that matches the value of the type attribute for the <aggregate>. The Excel formulas you can generate are limited to those equivalent to the computations you can specify with the aggregate type attribute, see <aggregate>.
Aggregates also support excelNumberFormat for xlsx mode.
When using aggregates, you must provide an <aggregate> element for each column in the generated Excel spreadsheet. You can set type="PLACEHOLDER" in <aggregate> elements where you do not wish to calculate an aggregate. With AGGREGATETAG="aggregate", the following <report> block generates an Excel spreadsheet in xlsx mode that treats the values for AdultPrice and ChildPrice as numbers, and includes formulas to average those columns.
<report xmlns="http://www.intersystems.com/zen/report/definition"
  name="ReportExample"
  sql="Select Top 3 TheaterName, AdultPrice, ChildPrice from Cinema.Theater">
 <group name="Theater">
  <element name="TheaterName" field="TheaterName"/>
  <element name="AdultPrice" field="AdultPrice" isExcelNumber="true"/>
  <element name="ChildPrice" field="ChildPrice" isExcelNumber="true"/>
 </group>
 <aggregate type="PLACEHOLDER" />
 <aggregate field="AdultPrice" type="AVG" excelFormula="AVERAGE"
  excelNumberFormat="0.00"/>
 <aggregate field="ChildPrice" type="AVG" excelFormula="AVERAGE"
  excelNumberFormat="0.00"/>
</report>
The following is the XML generated by the preceding report. Note that isExcelNumber="true" in the report generates isExcelNumber="1" in the XML. The attribute aggregate="1" marks the items as aggregates, and the attribute excelFormula specifies the formula to use in the generated spreadsheet.
<ReportExample>
  <Theater>
    <TheaterName isExcelNumber="0">General Cinema Cambridge</TheaterName>
    <AdultPrice isExcelNumber="1">7.25</AdultPrice>
    <ChildPrice isExcelNumber="1">5.75</ChildPrice>
  </Theater>
  <Theater>
  <TheaterName isExcelNumber="0">Boston Multiplex</TheaterName>
    <AdultPrice isExcelNumber="1">6.25</AdultPrice>
    <ChildPrice isExcelNumber="1">4.75</ChildPrice>
  </Theater>
  <Theater>
    <TheaterName isExcelNumber="0">Loews Downtown</TheaterName>
    <AdultPrice isExcelNumber="1">7.50</AdultPrice>
    <ChildPrice isExcelNumber="1">6.00</ChildPrice>
  </Theater>
  <item aggregate="1" placeholder="1"/>
  <item aggregate="1" excelFormula="AVERAGE"
   excelNumberFormat="0.00">6.083333333333333333</item>
  <item aggregate="1" excelFormula="AVERAGE"
   excelNumberFormat="0.00">4.583333333333333333</item>
</ReportExample>
The following image shows the resulting Excel spreadsheet, with the formula visible for the average ChildPrice.
Multi-sheet Reports
You can create multiple Excel worksheets from a single Zen reports class. When you set the class parameter EXCELMULTISHEET to 1, Zen uses each group that is a direct child of <report> to create a worksheet in the Excel spreadsheet. The content of each group must create a valid Excel worksheet.
Zen reports does not support XSLTMODE="browser" or $XSLT=browser when EXCELMULTISHEET is 1. The reason is that export of the report to Excel is done primarily by an external Java program. Temporary files generated during export of a multiple-worksheet report are stored in the report's REPORTDIR. If REPORTDIR is null, they are stored where Caché keeps temporary files, which is C:\MyCache\Mgr\Temp by default. See the section “Setting a File Name for Intermediate and Final Files”.
By default, Zen reports follows the excel convention of naming multiple worksheets Sheet1, Sheet2, and so forth. For example, with EXCELMULTISHEET=1, the following <report> block generates an Excel spreadsheet containing two worksheets, named Sheet1, and Sheet2:
<report xmlns="http://www.intersystems.com/zen/report/definition"
     name="MyReport" runonce="true">
  <group name="Persons"
    sql="SELECT top 2 name,Home_City as city,age,dob from Sample.Person order by Home_City"
    runtimeMode="1">
    <group name="Person">
      <element field="name" name="name"/>
      <element field="city" name="city"/>
      <element field="age" name="age" isExcelNumber="true"/>
      <element field="age" name="age1" isExcelNumber="true"/>
      <element field="dob" name="dob" isExcelDate="1"/>
    </group>
    <aggregate type="PLACEHOLDER" excelName="A1"/>
    <aggregate name="city" field="city" type="CUSTOM"
      class="%ZEN.Report.Aggregate.CountDistinct" excelName="A2"/>
    <aggregate field="age" type="SUM" excelFormula="SUM" excelName="A3"/>
    <aggregate field="age" type="SUM" excelFormula="SUM" excelName="A4"/>
    <aggregate type="PLACEHOLDER" excelName="A5"/>
  </group>
  <group name="Cinemas"
    sql="SELECT top 2 TheaterName,AdultPrice,ChildPrice from Cinema.Theater order by TheaterName">
    <group name="Cinema">
      <element field="TheaterName" name="TheaterName" excelName="Theater Name"/>
      <element field="AdultPrice" name="AdultPrice" isExcelNumber="true" excelName="Adult Price"/>
      <element field="ChildPrice" name="ChildPrice" isExcelNumber="true" excelName="Child Price"/>
    </group>
    <aggregate type="PLACEHOLDER"/>
    <aggregate name="TotalAdultPrice" field="AdultPrice" type="SUM" excelFormula="SUM"/>
  </group>
</report>
The following images show the two resulting worksheets in the Excel spreadsheet.
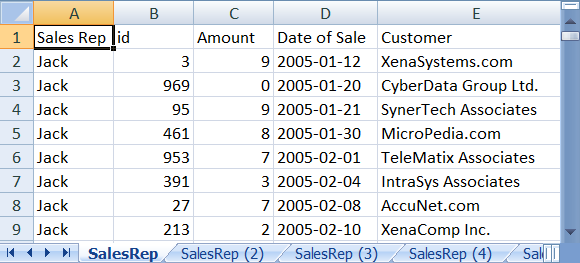
You can use the property excelSheetName on <report> or <group> to specify a name for the excel worksheet.
<report xmlns="http://www.intersystems.com/zen/report/definition"
name='myReport'
sql="SELECT ID,Customer,Num,SalesRep,SaleDate
 FROM ZENApp_Report.Invoice
 WHERE (Month(SaleDate) = ?) OR (? IS NULL)
 ORDER BY SalesRep,SaleDate">
 <parameter expression='..Month'/>
 <parameter expression='..Month'/>

  <group name='SalesRep' breakOnField='SalesRep'
   excelSheetName="SalesRep">
   <group name="record">
   <element name='salesrep' field="SalesRep" excelName="Sales Rep"/>
   <element name='id' field='ID' isExcelNumber="true"/>
   <element name='number' field='Num'
    isExcelNumber="true" excelName="Amount"/>
   <element name='date' field='SaleDate'
    isExcelDate="true" excelName="Date of Sale"/>
   <element name='customer' field='Customer' excelName="Customer"/>
  </group>
 </group>
</report>
The following image shows the first four of the six generated worksheets. Note that the report sets the value of excelSheetName on the group that is an immediate child of <report>. That value is used in generating sequential names for the worksheets.
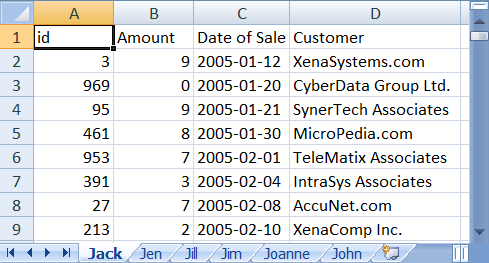
You can also use a runtime expression as the value of excelSheetName. The next example uses that feature to use the names of the sales reps to name the sheet containing their sales information:
<report xmlns="http://www.intersystems.com/zen/report/definition"
name='myReport'
sql="SELECT ID,Customer,Num,SalesRep,SaleDate
 FROM ZENApp_Report.Invoice
 WHERE (Month(SaleDate) = ?) OR (? IS NULL)
 ORDER BY SalesRep,SaleDate">
 <parameter expression='..Month'/>
 <parameter expression='..Month'/>

  <group name='SalesRep' breakOnField='SalesRep'
   excelSheetName='!..GetName()'>
   <group name="record">
   <element name='salesrep' field="SalesRep" excelName="Sales Rep"/>
   <element name='id' field='ID' isExcelNumber="true"/>
   <element name='number' field='Num'
    isExcelNumber="true" excelName="Amount"/>
   <element name='date' field='SaleDate'
    isExcelDate="true" excelName="Date of Sale"/>
   <element name='customer' field='Customer' excelName="Customer"/>
  </group>
 </group>
</report>
This report requires the following method:
Method GetName()
 {
  quit %val("SalesRep")
 }
It produces the following report, with each worksheet named for the corresponding sales rep.
If you need further control over the way sheet names are generated, you can override the method %getUniqueExcelSheetName. The following code sample shows the method as it is defined in %ZEN.Report.reportPageOpens in a new tab.
Method %getUniqueExcelSheetName(excelSheetName As %String) As %String
{
 Set count=$i(%excelSheetNames(excelSheetName))
 if count>1 {
  quit excelSheetName_" ("_count_")"
 }
 else
 {
  quit excelSheetName
 }
}
Generating Excel Spread Sheets from Arbitrary XML
Prior to Caché version 2015.1, Excel spread sheets could be generated only from a report having a ReportDefinition block with a specific structure, which generated XML suitable for conversion into a spread sheet. With version 2015.1 and higher, you can use the ReportDisplay block to convert the XML output of an arbitrary ReportDefinition block into the structure required to generate an Excel spread sheet. The following figure shows how elements in the ReportDisplay map to components of the spread sheet.
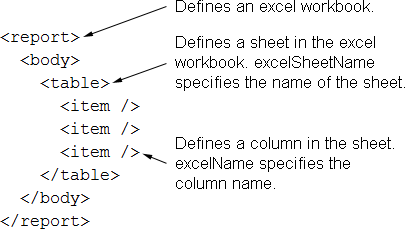
Each table in the ReportDisplay corresponds to a sheet in the Excel workbook. Tables cannot be nested. The parameter EXCELMULTISHEET is ignored in displayxlsx mode. The <item> element supports the attributes isExcelNumber and excelNumberFormat. These attributes are used like the similarly-named attributes in the ReportDefinition to control interpretation of the output in Excel. The <table> element uses the attribute excelSheetName to supply a name for the corresponding sheet in the spread sheet.
When generating Excel output in displayxlsx mode, dates must be in Excel format. You need to call the ToExcelDate method to convert dates in $HORLOG format to the Excel date format. Convert from other date formats to Excel date format by first converting to $HORLOG format and then calling ToExcelDate.
The following code sample shows a ReportDefinition that generates XML.
<report
 xmlns="http://www.intersystems.com/zen/report/definition"
 name="MyReport" runonce="true">
  <group name="Persons"
   sql="SELECT top 10 name,age from Sample.Person "
   runtimeMode="1" >
    <group name="Person" >
     <attribute name="name" field="Name"/>
     <attribute name="age" field="Age"/>
    </group>
  </group>
  <aggregate name="avgage" field="Age" type="AVG"/>
  <group name="Cinemas"
   sql="SELECT TheaterName,AdultPrice,ChildPrice
   from Cinema.Theater order by TheaterName" >
    <group name="Cinema">
     <element field="TheaterName" name="TheaterName" />
     <element field="AdultPrice" name="AdultPrice" />
     <element field="ChildPrice" name="ChildPrice" />
    </group>
    <aggregate name="TotalAdultPrice"
     field="AdultPrice" type="SUM" />
  </group>
</report>
The next sample shows a ReportDisplay that configures the XML for Excel report generation. Note that it references the ReportDefinition groups “Persons/Person” and “Cinemas/Cinema”, and generates additional XML in the ReportDisplay.
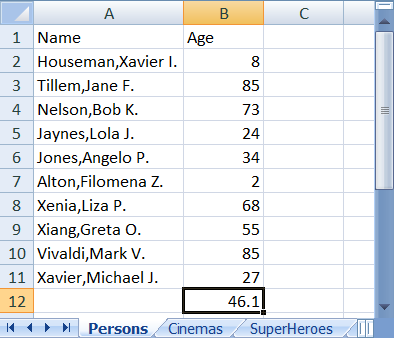
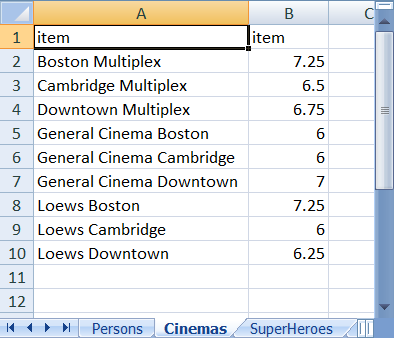
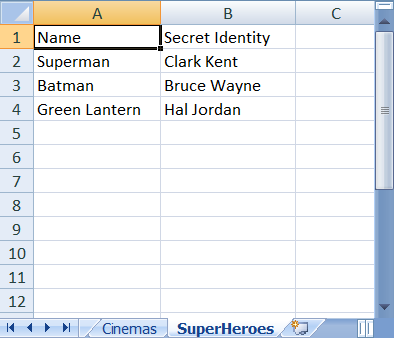
<report
 xmlns="http://www.intersystems.com/zen/report/display"
 name="MyReport">
 <body>
  <table group="Persons/Person" excelSheetName="Persons"
   width="100%" oldSummary="false">
   <item field="@name" excelName="Name" width="25%"/>
   <item field="@age" isExcelNumber="true"
    excelName="Age" width="10%">
    <summary value=" " isExcelAggregate="true" />
    <summary field="avgage"
     formatNumber='###,###,##0.00;(#)'
     isExcelAggregate="true"
     excelFormula="AVERAGE"/>
   </item>
  </table>
  <table group="Cinemas/Cinema"
   excelSheetName="Cinemas" >
    <item field="TheaterName"/>
    <item field="AdultPrice" isExcelNumber="true"/>
   </table>
   <table staticTable="true"
    excelSheetName="SuperHeroes" >
    <tr>
     <item value="Superman" excelName="Name"/>
     <item value="Clark Kent" excelName="Secret Identity"/>
    </tr>
    <tr>
     <item value="Batman" excelName="Name"/>
     <item value="Bruce Wayne" excelName="Secret Identity"/>
    </tr>
    <tr>
     <item value="Green Lantern" excelName="Name"/>
     <item value="Hal Jordan" excelName="Secret Identity"/>
    </tr>
  </table>
 </body>
</report>
The following three figures show the Excel output.
The Excel Server
Zen reports provides Excel Server capability to improve performance when creating Excel spread sheets. The Excel Server is a Java Virtual Machine process which runs in the background and creates Zen report Excel output. By running as a background process, the Excel Server eliminates the overhead of starting the Java Virtual Machine.
The Management Portal Excel Servers page (System Administration > Configuration > Zen Reports > Excel Servers) lists currently configured Excel Servers. When Caché is first installed, there are no Excel Servers configured. If you have configured an Excel Server, it starts automatically when you create a report as an Excel spread sheet.
Creating a Excel Server
The New Excel Server button opens the New Zen Report Excel Server page, which lets you configure a new Excel Server. The first three fields are required, the remaining fields are optional.
-
Name: A unique name for the Excel Server.
-
Port: The TCP port that the Excel Server uses to receive reports.
-
Ping Port: The TCP port that the Excel Server uses for all other communication, such as status queries and shutdown requests.
-
Num Threads: If the Excel Server is using multi-threaded Java, this field supplies the number of threads used by the Excel Server for report rendering.
-
Num Ping Threads: If the Excel Server is using multi-threaded Java, this field supplies the number of threads used by the Excel Server for other communication.
-
Log Level: Standard Java parameters to control logging. If you choose to enable logging, the following three items appear on the form:
-
Log File: By default, the Excel Server log file is created in your home directory. You can specify an alternate location here. On Unix systems, in order to avoid privilege issues, specify a location where the user has appropriate permissions.
Each time you stop and restart the Excel Server, it begins a new log file. The Excel Server also starts a new log file when the file size exceeds the limit set by Max. File Size. The log file names have a numeric suffix. The file ending in .0 is the most recent, and as new files are created, the previous ones are renamed with larger suffix numbers, until the number of files reaches the limit set by Rotation Count. Then the names recycled and older information is lost. This field supplies the path and base file name of the log file.
If you configure more than one Excel Server, providing log file names makes it easy for you to match log files with the Excel Server that created them.
-
Max. File Size: Maximum size of the Excel Server log file. The Excel Server creates a new log file when the size of the current log file reaches this limit.
-
Rotation Count: The maximum number of log files. The Excel Server recycles file names, losing older information, when the number of log files reaches this limit.
-
-
Initialization Timeout: The amount of time in seconds that Zen reports waits for the Excel Server to start up. An error occurs if the Excel Server fails to start in this time.
-
Connection Timeout: The amount of time in seconds that Zen reports waits for the Excel Server to connect when rendering a report. You normally expect connection to take less time than initialization. An error occurs if the Excel Server fails to connect in this time.
Use the Save button to save your changes, or the Cancel button to return to the Zen Report Excel Servers page. Once you have saved your changes, you see that the new Excel Server has been added to the list.
Managing the Excel Server
The Manage button, which is located to the right of each listing on the Excel Servers page (System Administration > Configuration > Zen Reports > Excel Servers), lets you edit values and perform additional tasks:
-
Delete: Removes the Excel Server. You cannot edit or delete a Excel Server while it is running.
-
Start: Starts the Excel Server. Asks for confirmation and provides some information on its status. Note that the Excel Server starts automatically when you generate a report using the Excel Server port.
-
Stop: Stops the Excel Server. Asks for confirmation and provides some information on its status.
-
Verify: Checks status of ports assigned to the Excel Server. You expect the ports to be in use if the Excel Server is running, and not in use if it is not.
-
Activity: Summarizes activity on this Excel Server since the last shutdown.
-
Log: Opens the log file. Maximum file size displayed in the browser is 1 megabyte, and files larger than this limit are truncated.
In your Zen report you can set the EXCELSERVER class parameter or the ExcelServer property to the port the Excel Server is listening on. Then load the page with the mode set to excel. You can also set EXCELSERVER class parameter for an entire Zen Application.
The Zen report property ExcelServerTimeOut controls the length of time the report waits for the Excel Server before timing out. A positive integer specifies the number of seconds to wait before timing out. A value of 0 means timeout immediately, and a value of –1 means never timeout. You can also pass the timeout interval in the URL using $EXCELSERVERTIMEOUT. The default value is null ("" in Caché), which means never timeout.
Communicating with the Excel Server
The class %ZEN.Report.PingOpens in a new tab provides the ping method that you can use to communicate with the Excel Server.
In addition to the port and server type, ping returns the maximum memory available, the committed memory, and the amount of memory used. The Excel Server attempts to use the Java tenured generation pool to get information about memory and return this information to ping. If the Excel Server cannot find the Java tenured generation pool, it returns a blank string ("") for the value of maximum memory and used memory.
The ping method also returns the runtime name in the form pid@hostname. You can use $PIECE to process the string and get the process id.
The following example shows how to use ping:
 set Status=##class(%ZEN.Report.Ping).ping("1234",30,.port,.servertype,.memMax,.memCommitted,.memUse,.runtimeName)
 write !,"port="_port
 write !,"servertype="_servertype
 write !,"memMax="_memMax
 write !,"memCommitted="_memCommitted
 write !,"memUse="_memUse
 write !,"runtimeName="_runtimeName
Invoking Zen Reports from the Command Line
There are three methods that you can invoke to run a Zen report from the command line:
-
GenerateReport generates the report and saves it to a file.
-
GenerateReportToStream generates the report and returns it as a stream object.
-
GenerateToFile generates the report and saves it to a file. Unlike the other two methods, GenerateToFile is a class method, so you can call it without instantiating the report object as is necessary for GenerateReport and GenerateReportToStream.
A Zen report class also has properties that you can use with any of the command line methods to provide input to the report via stream objects. These properties are xmlstream, toexcelstream, tohtmlstream, and toxslfostream. They are all discussed in the section “Zen Report Class Properties.”
The GenerateReport Method
The command to run a report called MyReport in the SAMPLES namespace using GenerateReport looks like this. You can set any properties of the report before generating it, as shown for report.Month in this example:
 ZN "SAMPLES"
 SET rpt1=##class(ZENApp.MyReport).%New()
 SET rpt1.Month=1
 SET Status=rpt1.GenerateReport("c:\temp\MyReport2.pdf",2)
 DO $system.Status.DisplayError(Status)
The parameters in the call to GenerateReport are as follows:
-
outputfile is a string that gives the pathname of the output file.
-
mode is an integer that tells Zen which type of report output to generate.
Possible values include:
-
0 — XML
-
1 — HTML
-
2 — PDF, works only if you have already used the instructions in the section “Configuring Zen Reports for PDF Output.”
-
3 — ToHTML stylesheet
-
4 — ToXSLFO stylesheet
-
5 — XSD schema
-
6 — PrintPS, send PostScript to the printer whose location is identified by the PS class parameter
-
7 — Excel spreadsheet
-
8 — XSLFO
-
10 — xlsx, Excel spreadsheet, in native format
-
11 — tiff image format, requires installation of JAI Advanced Imaging I/O, see “Configuring for TIFF Generation.”
-
12 — Generate a report in PDF format, and send it directly to a printer via the Print Server, see “The Print Server.” Equivalent to the DEFAULTMODE and $MODE value “pdfprint”.
-
13 — displayxlsx, Excel spreadsheet, using a ReportDisplay block to transform arbitrary XML into the format required for Excel generation.
-
14 — fo2pdf, direct rendering of PDF from an FO file. This allows SVG to be stored in the database and then rendered as part of a PDF.
-
15 — foandpdf, first generates an FO file and then generates PDF from the FO file. Allows you to better store SVG in the database and retrieve it for display in the PDF.
-
-
log is an optional third parameter:
Do report.GenerateReport("C:\Temp\mySamplePDF.log",2,1)If the value of log is 1 (true), the output file contains the transformation log rather than the report. This log is similar to the result in the browser when you supply the query parameter $LOG=1. If you omit this parameter, the default is false, and no log file is created.
-
renderServer is an optional fourth parameter:
Do report.GenerateReport("C:\Temp\mySamplePDF",2,0,57777)This argument is renderServer, which is the port number of the HotJVM rendering server to render PDF files.
-
ExcelMode is an optional fifth parameter:
Do report.GenerateReport("C:\Temp\mySampleEXC",7,0,"","attribute")This argument determines whether an Excel spreadsheet is generated from data in elements or attributes. It is used infrequently, because you generally control this attribute of the report by setting the EXCELMODE parameter in the report itself.
The following example generates a PDF:
 ZN "SAMPLES"
 SET %request=##class(%CSP.Request).%New()
 SET %request.URL = "/csp/samples/ZENApp.MyReport.xml"
 SET %request.CgiEnvs("SERVER_NAME")="127.0.0.1"
 SET %request.CgiEnvs("SERVER_PORT")=57777
 SET report = ##class(ZENApp.MyReport).%New()
 SET report.Month = 3
 SET Status = report.GenerateReport("C:\Temp\X.PDF",2)
 IF 'Status DO $system.Status.DecomposeStatus(Status,.Err) WRITE !,Err(Err) ;'
 WRITE !,Status
It sets up a %request, which you may need to do under special circumstances, for instance, if your report uses %request in some of its methods. The example also includes error handling following the call to GenerateReport. In the example, Status is a %StatusOpens in a new tab object that contains information about the call, and Err is the text message associated with Status.
The following example generates PostScript:
 SET %request=##class(%CSP.Request).%New()
 SET %request.URL = "/csp/samples/ZENApp.MyReport.xml"
 SET %request.CgiEnvs("SERVER_NAME")="127.0.0.1"
 SET %request.CgiEnvs("SERVER_PORT")=57772
 SET report=##class(ZENReports.CurrentAdmissions).%New()
 SET %request.Data("$PS",1)="\\traksydfp1\ESTUDIO4511"
 SET Status=report.GenerateReport("C:\temp\output.txt",6)
 IF 'Status DO $system.Status.DecomposeStatus(Status,.Err) WRITE !,Err(Err) ;'
 WRITE !,Status
In order to generate files in TIFF image format, you must install JAI Advanced Imaging I/O. TIFF generation is supported only through FOP not through RenderX. See “Configuring for TIFF Generation.”
The following example generates a TIFF file:
 zn "SAMPLES"
 s rpt1=##class(ZENApp.MyReport).%New()
 s rpt1.Month=1
 s Status=rpt1.GenerateReport("c:\temp\MyReport.tiff",11)
 i 'Status d $SYSTEM.Status.DecomposeStatus(Status,.Err) w !,Err(Err) ;'
 w !,Status
The GenerateToFile Method
GenerateToFile works just like GenerateReport except that it is a class method, so you can call it without instantiating the report object.
The GenerateReportToStream Method
There is a method called GenerateReportToStream that works just like GenerateReport except that its first parameter is not a file name; it is a %Stream.ObjectOpens in a new tab passed by reference. When the method returns, this %Stream.ObjectOpens in a new tab contains the report. If the logging parameter was set to true, the %Stream.ObjectOpens in a new tab contains the log file instead of the report.
Zen Report Class Properties
The typical strategy is to allow your Zen report to generate an XML data source and different types of XSLT stylesheet for you, but you can provide them to Zen from external files or as stream objects. A Zen report class has properties that you can use with any of the command line methods to input stream objects to the report.
The following are some examples of setting these properties. You can only set these properties programmatically or from the command line, not from a URI. In the examples, each call to httprequest.Get would normally appear all on one line; the lines are broken for typesetting purposes. Each of these stream object properties is of type %Library.RegisteredObjectOpens in a new tab:
xmlstream is a stream object that provides the XML data source. For example:
 ZN "SAMPLES"
 Set httprequest=##class(%Net.HttpRequest).%New()
 Set httprequest.Server="localhost"
 Set httprequest.Port="57777"
 Set sta=httprequest.Get(
 "/csp/my/my.mine.cls?$MODE=xml&CacheUserName=_SYSTEM&CachePassword=SYS")
 If $system.Status.IsError(sta) Do $system.OBJ.DisplayError(sta)
 Set rpt=##class(jsl.MyReportDisplay).%New()
 Set rpt.Month=1
 Set rpt.xmlstream=httprequest.HttpResponse.Data
 Set tSC=rpt.GenerateReport("C:\TEMP\MyReportDisplay.pdf",2)
 If 'tSC Do $system.Status.DecomposeStatus(tSC,.Err) Write !,Err(Err) ;'
 Write !,tSC
tohtmlstream is a stream object that provides the XSLT stylesheet for XHTML output. For example:
 ZN "SAMPLES"
 Set httprequest=##class(%Net.HttpRequest).%New()
 Set httprequest.Server="localhost"
 Set httprequest.Port="57777"
 Set sta=httprequest.Get(
 "/csp/my/my.mine.cls?$MODE=tohtml&CacheUserName=_SYSTEM&CachePassword=SYS")
 If $system.Status.IsError(sta) Do $system.OBJ.DisplayError(sta)
 Set rpt=##class(ZENApp.MyReport).%New()
 Set rpt.tohtmlstream=httprequest.HttpResponse.Data
 Write !,httprequest.HttpResponse.Data
 Set rpt.Month=1
 Set tSC=rpt.GenerateReport("C:\TEMP\MyReport.html",1)
 If 'tSC Do $system.Status.DecomposeStatus(tSC,.Err) Write !,Err(Err) ;'
 Write !,tSC
toexcelstream is a stream object that provides the XSLT stylesheet for Excel spreadsheet output. Its use is similar to tohtmlstream.
toxslfostream is a stream object that provides the XSLT stylesheet for translation to XSL-FO for PDF output. For example:
 ZN "SAMPLES"
 Set httprequest=##class(%Net.HttpRequest).%New()
 Set httprequest.Server="localhost"
 Set httprequest.Port="57777"
 Set sta=httprequest.Get(
 "/csp/my/my.mine.cls?$MODE=toxslfo&CacheUserName=_SYSTEM&CachePassword=SYS")
 If $system.Status.IsError(sta) Do $system.OBJ.DisplayError(sta)
 Set rpt=##class(ZENApp.MyReport).%New()
 Set rpt.toxslfostream=httprequest.HttpResponse.Data
 Write !,httprequest.HttpResponse.Data
 Set rpt.Month=1
 Set tSC=rpt.GenerateReport("C:\TEMP\MyReport.pdf",2)
 If 'tSC Do $system.Status.DecomposeStatus(tSC,.Err) Write !,Err(Err) ;'
 Write !,tSC
Exposing Zen Report Data as a Web Service
If the viewers of your Zen report are interested in acquiring the underlying XML data for the report, you can expose the data as a Web service.
By definition, a Web service has an associated WSDL — a service description written in the Web Services Description Language — that describes the contents of a SOAP request and response. If viewers want the data from your Zen report, you can create this WSDL and give the viewers its URI. The viewers can use their preferred tool to consume this Web service and do what they want with the data.
You can expose Zen report data as a Web service programmatically or from the command line as follows:
-
Create an instance of the data class generator %ZEN.Report.reportDataClassesOpens in a new tab. This generator class has two features, which you can control independently:
-
It can create a package of data classes that represent the XML data generated by a Zen report.
-
It can generate a Web service through which a user can issue a SOAP request for the XML data represented by data classes.
-
-
Identify inputs to and outputs from the data class generator:
To set this value… Set this property of the generator class… Default value is… Zen report package and class name ZenReport — Package name for output data classes DataPackage — Package name for output Web service WebServicePackage — SOAP namespace for the Web service Namespace http://tempuri.org Boolean flag that indicates whether or not the namespaces of the referenced classes are used in the WSDL UseClassNamespaces 1 (true) -
Tell the data class generator what you want it to do:
To generate this output… Invoke this method of the generator class… Web service and data classes generateWebService() Data classes only generateDataClasses() Web service only generateWebServiceShell(zenReportPackageAndClassName) -
Check for any errors returned by the class method.
For example:
 ZN "SAMPLES"
 Set gen=##class(%ZEN.Report.reportDataClasses).%New()
 Set gen.ZenReport="ZENApp.MyReport"
 Set gen.DataPackage="ReportData1"
 Set gen.WebServicePackage="WebService1"
 Set Status=gen.generateWebService()
 If 'Status Do $system.Status.DecomposeStatus(Status,.Err) Write !,Err(Err) ;'
 Write !,Status
 Kill