Debugging
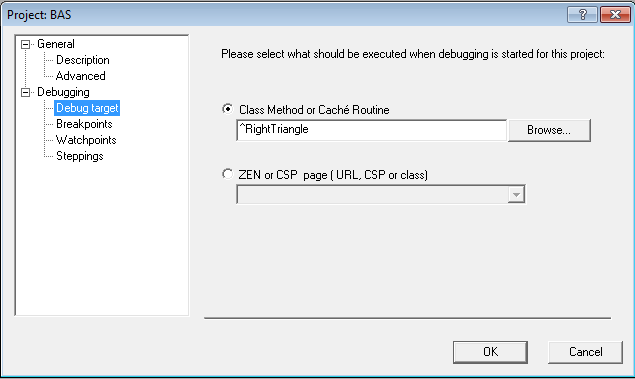
We've come pretty far already, but we should pause to discuss debugging ObjectScript routines. Studio provides an interactive debugger for ObjectScript. Within a project's settings—click Project and then Settings—specify a Debugging Target, which is usually the routine you want to debug.
Use F9 to toggle one or more breakpoints in the routine. You can also set watchpoints, by clicking Project, Settings, and Watchpoints. A breakpoint is a location within a routine where execution will stop. A watchpoint is a variable that will cause execution to stop whenever its value changes. Click F5 to run the routine using the debugger. Studio will create a Terminal process, attach to it, and display it in the Output window. Your routine will run in that process, stopping when it reaches a breakpoint or a watchpoint. In Studio, use F10 (step over) and F11 (step into) to step through the code. The Watch window allows you to specify variables and displays their changing values as the code runs.
You can also debug a routine from the Terminal:
-
Set a breakpoint, by editing the routine, and adding the Break command at the location where you want execution to stop. Note that another developer running this routine from the Terminal will also encounter this breakpoint.
-
Set a breakpoint or watchpoint from the Terminal prompt using the ZBreak command, without editing the routine. This breakpoint or watchpoint applies to your session only.
The next few slides cover the ZBreak command. You can read more about Debugging in general and the Break and ZBreak commands in particular in the Caché Programming Guide.