Filtering Pivot Tables
This chapter describes how to use the Analyzer to include filters in a pivot table, which restricts the set of records that the pivot table accesses. It discusses the following topics:
-
How to add a simple filter by dragging and dropping filter items
-
How to add a simple filter by creating and using a drop-down menu
Applying a filter to a pivot table is different from adding a filter control to a pivot table widget in a dashboard (see Creating DeepSee Dashboards). A filter control enables another user later to filter the data. You can add filter controls to a widget that displays a pivot table that has its own filter.
About Filters
Filters restrict the set of records that the system uses.
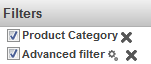
You use the Filters box, shown below, to add filters to your pivot table:
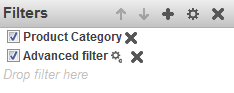
Filters can be either simple or advanced, and you can add any combination of filters to your pivot table.
To create simple filters, you can also drag and drop filter items to the filter bar directly above the pivot table:
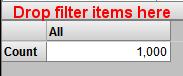
Later sections describe how to create these filters in detail.
Dragging and Dropping Filter Items
You can drag and drop an individual member to use as a filter. To do so, drag and drop a member to Drop filter here in the Filters box or to the filter bar.
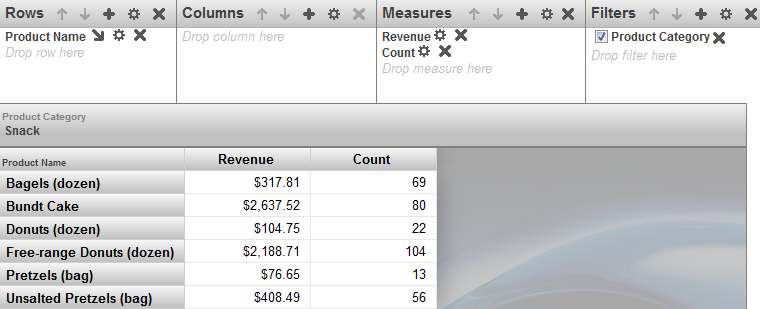
The pivot table is then filtered to show only data for that member. The Filters box displays the name of the associated level, and the filter bar displays the name of the level and the member. For example:
Creating and Using a Drop-Down Menu
You can drag and drop a level to the Filters box or the filter bar and then use the filter drop-down menu that the system displays. This section provides the details. (You can use expression pivot variables in the same way. See “Defining and Using Expression Pivot Variables,” later in this book.)
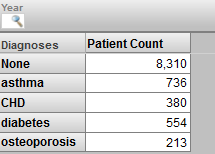
For example, if you drag and drop the Year level, you might see this in the Analyzer (depending on what else you have done):
Then you can use the control to select members of the Year level. When you click the Search button  , you see something like this:
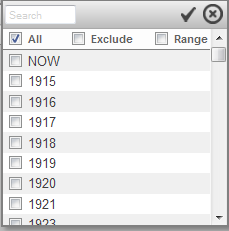
Here you can do the following:
-
Select All to see all members of this level (that is, perform no filtering with this level).
-
Select one or more members to filter the pivot table to use only data for those members.
You must press Ctrl while selecting multiple members.
-
Select one or more members and select Exclude Members to filter the pivot table to use data for all members except for the selected ones.
-
Click Range and then specify an inclusive range of members. When you click Range, the control changes to look like this:
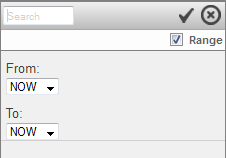
In each drop-down list, select a member. For a time level, the list of members includes NOW, which always refers to the current date.
For other options, see “Filtering Data,” in the chapter “Using Dashboards” in DeepSee End User Guide.
When you are done, click the check mark button to accept the selections. Or click the X button to discard your changes.
The filter control is part of the Pivot Builder area, not part of the Pivot Preview area. This has two implications:
-
When you save the pivot table, the Analyzer saves any selections in the filter control. When you next open the pivot table, the Analyzer redisplays the filter control as you saved it.
-
The pivot table as seen in a dashboard is filtered as you saved it and does not include the filter control. (You use a separate mechanism to provide filters to users of your dashboards.)
Adding Advanced Filters
To see the filter definition for an advanced filter, click the Advanced Options button  next to that filter. DeepSee then displays a dialog box with information like the following:
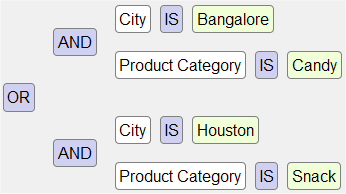
This represents the logic of the filter, but not its literal syntax. This filter selects only products that are either of the following:
-
Candy products sold in Bangalore
-
Snack products sold in Houston
The Advanced Filter Editor enables you to easily add, modify, and remove parts of a filter expression, while seeing the resulting expression with every change. This book does not describe this tool in detail, but instead provides a brief demonstration:
-
Click the Advanced Options button
 in the Filters box. The system displays a dialog box like the following:
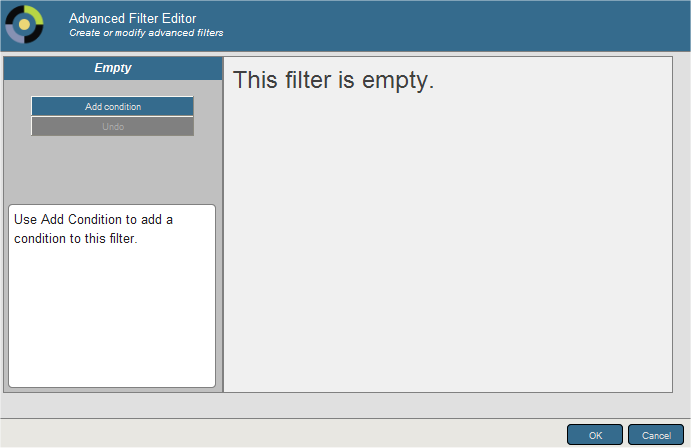
-
Click Add Condition.
The dialog box now looks something like this:
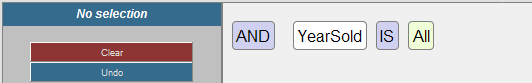
Initially, the advanced filter editor uses the first level (considering alphabetic order) defined in your subject area.
-
If you want to use a different level:
-
Click YearSold, which enables you to edit this part of the expression.
-
Optionally type a string into the search box and then click Search. This is useful if the cube has a large number of levels.
-
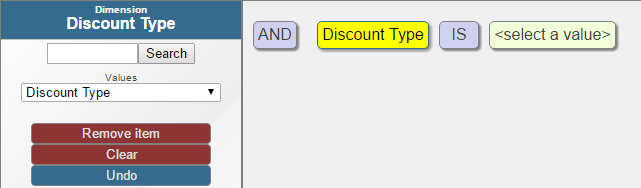
Select a level from the drop-down list on the left. As soon as you do, the expression is updated. For example:
The end of the drop-down list may include measures; if so, see “Filtering the Data by Measure Value,” later in this chapter.
-
-
If you want to change the operator from IS to IS NOT:
-
Click IS, which enables you to edit this part of the expression.
-
In the left area, click IS NOT. As soon as you do, the expression is updated.
-
-
To specify a member of the level:
-
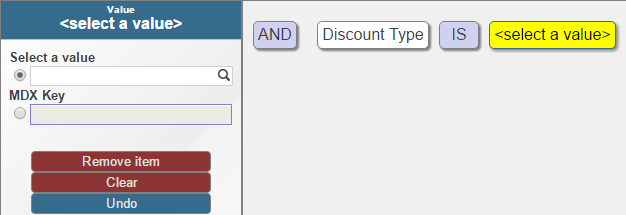
Click <select a value>, which enables you to edit this part of the expression. The left area might look like the following:
-
In the left area, click the Search button
under Select a value to display a dialog. -
The resulting dialog displays a set of members and options. Optionally type text into the search box and press Enter; this restricts the set of members listed in the dialog.
The list of values also includes all searchable measures (see the next section) and all pivot variables (see “Defining and Using Pivot Variables,” later in this book).
-
Select members and options by selecting their check boxes.
-
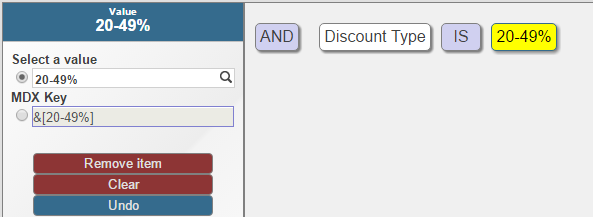
Click the check mark button in the upper right hand corner of the dialog. As soon as you do, the expression is updated.
For example:
-
Alternatively, you may enter an MDX key by selecting the MDX Key option.
This advanced filter is equivalent to a simple filter. Typically you would now add another condition or a branch that contains other conditions.
-
-
To add another condition:
-
Click AND, so that you can edit this item.
-
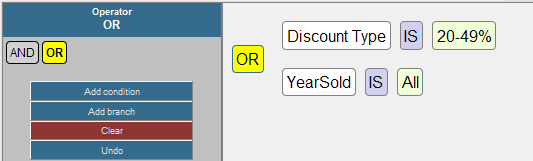
Optionally, in the left area, click OR. As soon as you do, the expression is updated.
-
Click Add condition.
You might now see the following:
-
Edit this condition in the same way that you edited the first one.
-
-
Click OK to close the dialog box.
Or add another condition or a branch that contains other conditions.
Note that you can undo any change. To do so, click Undo.
Filtering the Base Records by Measure Value
If your subject area includes searchable measures, you can filter records used in a pivot table by the value of those measures. To do so:
-
Click the Advanced Options button
in the Filters box. -
Click Add Condition.
The dialog box now looks something like this:
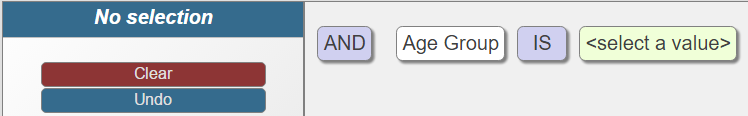
The advanced filter editor initially uses the first level (considering alphabetic order) defined in your subject area.
-
Click Age Group, which allows you to edit this part of the expression.
-
Click the drop-down list on the left and scroll to the end of the list, which may include measures. For example:
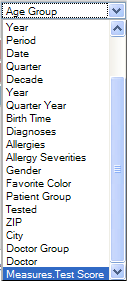
Note that the list of values also includes all pivot variables (see “Defining and Using Pivot Variables,” later in this book).
-
Click the measure that you want to use.
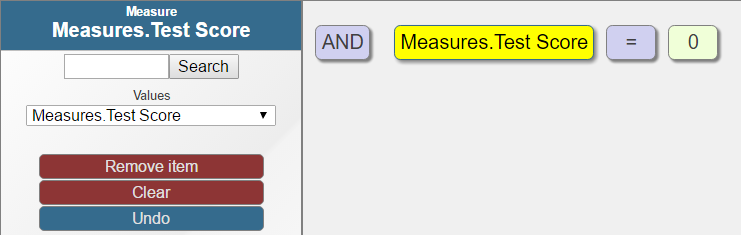
Now the expression is updated as follows:
-
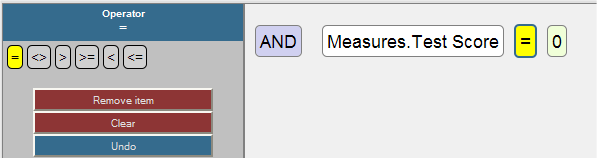
Click the operator, which is an equals sign (=) by default.
Now the editor displays the following set of operators:
Or, if the searchable measure contains string values, the editor displays the following operators: = <> LIKE
-
Click the comparison value, which is 0 by default.
Now the editor displays a box into which you can type a new value.
-
Type a value and then click Apply.
If you enter a string value, enclose it within single quotes. For example: 'abc'
-
Click OK to close the dialog box.
Or add another condition or a branch that contains other conditions.
For example, consider the following filter:
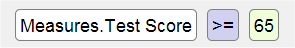
This filter selects all patients whose test score is 65 or higher.
Defining Named Filters
A named filter is saved with the subject area. You can use it in multiple pivot tables and in filter controls on dashboards.
To define a named filter:
-
Make sure that no named filter is currently selected.
-
Click the Named Filter button
 in the Model Contents pane.
 -
For Filter Name, type a user-friendly filter name.
-
For Description, type an optional description.
The rest of the dialog box is the same as the Advanced Filter Editor.
-
For details on the rest of this dialog box, see “Adding Advanced Filters,” earlier in this chapter.
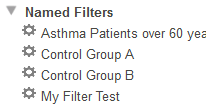
When you are done, the Model Contents pane displays the filter within the Named Filters section.
Because a named filter can be relatively complex, it can be useful to define appropriate named filters for use on dashboards. If you do this, users of the dashboards can filter their data more easily.
Redefining a Named Filter
To redefine a named filter:
-
Select the named filter in the Model Contents pane.
-
Click the Named Filter button
. -
Make changes as needed.
For details, see “Adding Advanced Filters,” earlier in this chapter.
Deleting a Pivot Variable
To delete a named filter:
-
Select the named filter in the Model Contents pane.
-
Click the X button.
-
Click OK to confirm this deletion.
Using Named Filters
To use a named filter, drag and drop it from the Model Contents pane to the Filters box.
Or double-click the named filter; then it is added to the Filters box.
Disabling or Removing Filters
To disable a filter, clear the check box to the left of the name of the filter in the Filters box.
To remove a filter, click the X to the right of the name of the filter.
How DeepSee Combines Filters
This section describes how the system combines filters.
If you apply multiple simple filters, the system combines them as follows (but see the important note after this list):
-
DeepSee uses a logical AND to combine all the items shown in the bar above the pivot table.
Filter Meaning 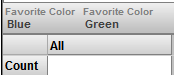
All patients whose favorite color is green and whose favorite color is blue (zero patients) 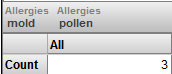
All patients who are allergic to both mold and to pollen 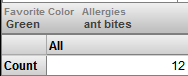
All patients whose favorite color is green and who are allergic to ant bites -
If this bar displays a level, and if you have selected one or more members of that level in the drop-down, those members are combined with a logical OR.
Filter Meaning 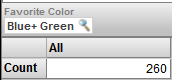
All patients whose favorite color is either green or blue 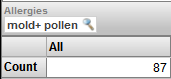
All patients who are allergic to mold, to pollen, or to both 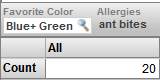
All patients whose favorite color is green or blue and who also are allergic to ant bites
If you have also applied advanced filters, those are combined with the other filters via logical AND.
Depending on the form of the combined filter, DeepSee might perform axis folding. This phrase refers to the process of combining multiple filters (a filter is considered to be a query axis). Axis folding means that if a given source record has a non-null result for each slicer axis, that record is counted multiple times. For details on when this occurs, see “Axis Folding” in the appendix “How the DeepSee Query Engine Works” in the DeepSee Implementation Guide.
Finding the Key for a Member
This section describes how and why to find the key identifier for a member.
Each member has two identifiers:
-
A name (shown in the Analyzer and pivot tables). For example, in the Patients sample, a member of the Doctor level might have the name Vivaldi, Lola
Names are not necessarily unique.
-
A key (never displayed). This is often but not always the same as the name. For example, in the Patients sample, the doctor whose name is Vivaldi, Lola might have the key 12
The keys should be unique in a well-defined cube. (DeepSee does not force them to be unique, but the developers who create a cube can and should take steps to ensure their uniqueness.)
When you create a filter by drag and drop actions, DeepSee automatically uses the member key rather than the member name.
You should use the key when you specify a filter value manually, which you do in the following scenarios:
-
When you specify the default value for a filter control on a dashboard (as described in Creating DeepSee Dashboards).
-
When you specify the initial value for a filter control via a dashboard URL (as described in the DeepSee Implementation Guide).
It is also best practice to use the key when you refer to a member in a pivot variable.
To find the key for a given member, do the following:
-
Drag and drop the member to the Filters box in the Analyzer.
-
Click the Display Query button
 on the toolbar.
 The system displays the current MDX query, which looks something like this:
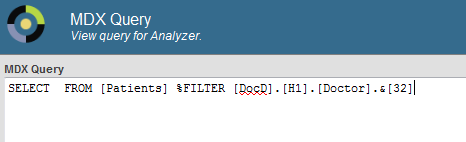
The %FILTER part specifies the filter. The [DocD].[H1].[Doctor].&[32] part is the complete member identifier for this member. The key for this member is 32.
If the level contains multiple members with the same name, and if you are not sure which member to use, try the following technique:
-
Drag and drop each of the members to Rows.
-
If this level has a property, drag and drop that to Columns. The property values are typically different for each member, and you can use the information here to determine which member to look at.
Or drag and drop a level to Columns. Choose a level that can give some context. In SAMPLES, you could display Doctor Group as columns. You might see something like this:
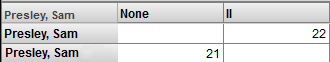
According to this pivot table, the first Sam Presley is not in any doctor group, and the second one is in doctor group II. You can use this information to determine which member to look at.
In other cases, it might be necessary to display a detail listing in order to correctly identify the desired member.