Introduction
This chapter introduces DeepSee models.
Be sure to consult the online InterSystems Supported PlatformsOpens in a new tab document for this release for information on system requirements for DeepSee.
Purpose of DeepSee
InterSystems DeepSee enables you to embed business intelligence (BI) into your applications so that your users can ask and answer sophisticated questions of their data. Your application can include dashboards like the following example:
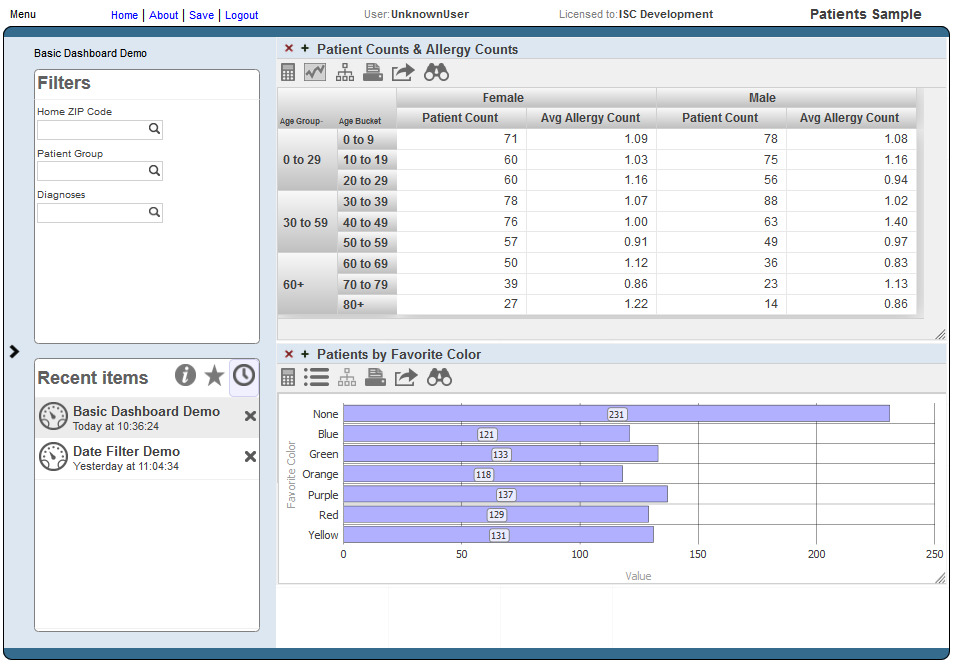
The widgets on a dashboard are driven by pivot tables and KPIs (key performance indicators). For a pivot table, a user can display a listing, which displays source values.
Pivot tables, KPIs, and listings are queries and are executed at runtime:
-
A pivot table can respond to runtime input such as filter selections made by the user. Internally it uses an MDX (MultiDimensional eXpressions) query that communicates with a DeepSee cube.
A cube consists of a fact table and its indices. A fact table consists of a set of facts (rows), and each fact corresponds to a base record. For example, the facts could represent patients or departments.
Depending on your configuration and implementation, DeepSee detects changes in your transactional tables and propagates them to the fact tables as appropriate.
DeepSee generates an MDX query automatically when a user creates the pivot table in the Analyzer.
-
A KPI can also respond to runtime user input. Internally, it uses either an MDX query (with a DeepSee cube) or an SQL query (with any table or tables).
In either case, you create the query manually or copy it from elsewhere.
-
A listing displays selected values from the source records used for the rows of the pivot table that the user has selected. Internally, a listing is an SQL query.
You can specify the fields to use and let DeepSee generate the actual query. Or you can specify the entire query.
Introduction to DeepSee Models
A model includes some or all of the following elements:
-
At least one cube definition. A cube describes ways that you can query a set of specific base elements (such as patients or transactions). A cube includes levels, which enable you to group records from the base set, and measures, which show aggregate values of those records. It also defines listings and other items.
When you create pivot tables, you use levels and measures. Consider the following pivot table:
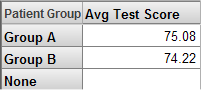
In this pivot table, the rows correspond to the members of the Patient Group level; each member is shown as one row. The data column displays the aggregate value of the Avg Test Score measure for each of these members; for this measure, the system computes the average value. Notice that the Avg Test Score is null for the None patient group.
-
Any number of subject areas. A subject area is a subcube that enables users to focus on smaller sets of data without the need for multiple cubes. A subject area also enables you to customize captions and defaults of the cube.
-
Any number of KPIs.
In DeepSee, a KPI is an interactive dataset that can be displayed on a dashboard. The KPI can define actions, which a user can launch and which execute your custom code. (Note that actions are discussed in “Defining Custom Actions” in the DeepSee Implementation Guide.)
You use these elements to create dashboards as follows:
-
Within the DeepSee Analyzer, you create pivot tables.
Each pivot table is a query that you create by drag and drop actions. The query runs against a cube or subject area.
-
Within the Dashboard Designer, you add pivot tables and KPIs to dashboards, along with any filter controls or other needed controls.
The chapter “Basic Concepts” provides an overview of cubes and subject areas. A model can contain many additional elements. See the chapter “Summary of Model Options” for a complete comparison of the options.
Introduction to the Model Development Process
The model development process typically is as follows:
-
Create, compile, and build a basic cube with only a few items.
-
Use the Analyzer or the DeepSee shell to examine the results and to identify changes to make.
For information on the Analyzer, see Using the DeepSee Analyzer.
For information on the shell, see Getting Started with DeepSee.
-
Repeat the preceding steps as necessary.
-
When the cube is finalized or nearly finalized, define subject areas based on the cube.
Note that you might need multiple cubes.
Introduction to the DeepSee Architect
You use the Architect to create cubes and subject areas.
To access the Architect, do the following:
-
Click the InterSystems Launcher and then click Management Portal.
Depending on your security, you may be prompted to log in with a Caché username and password.
-
Switch to the appropriate namespace as follows:
-
Click Switch.
-
Click the namespace.
-
Click OK.
-
-
Click DeepSee and then click Architect.
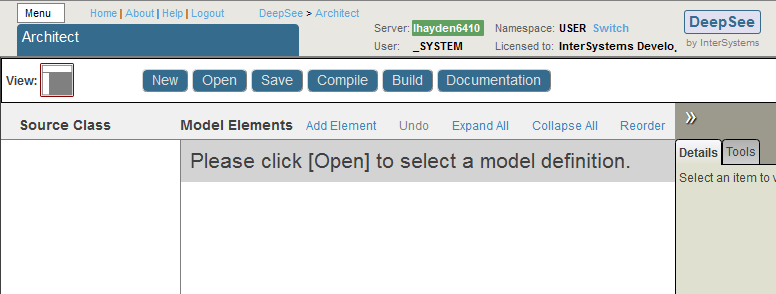
When you first display the Architect, you see the following:
-
Click Open, click Cubes, click the name of a cube, and then click OK.
Now the system displays something like the following:
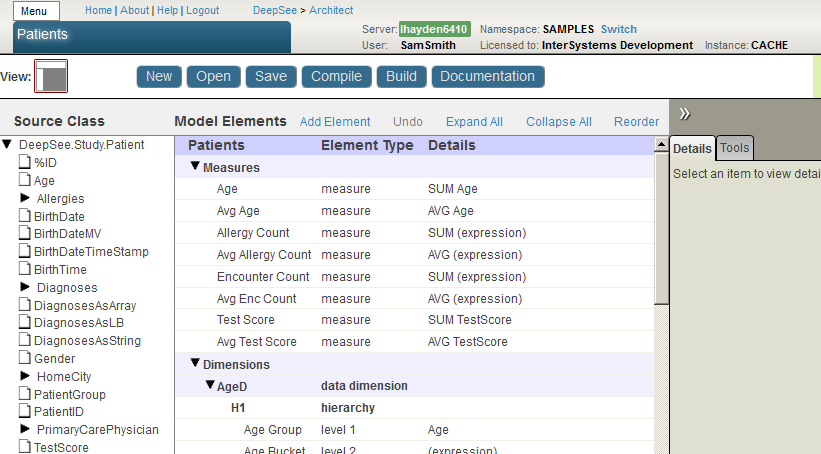
The top area contains navigation links and buttons to perform different tasks.
Below that, the page consists of the following areas, when the Architect is displaying a cube.
Class Viewer
The left area is the Class Viewer, and it shows the properties in the base class used by the cube; this area is not shown for a subject area. For example:
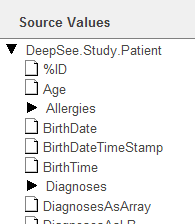
You can resize this area. To do so, drag the vertical divider on the right edge of this area.
The following rules control the display of a class in the Architect:
-
All properties are shown except for relationship properties, private properties, and transient properties.
-
This display is recursive; that is, properties of properties are shown.
-
If a property is a collection (a list or an array) or a relationship, it is shown as a folder that displays the properties of the class used in the collection or relationship.
-
If a property is of type %ListOpens in a new tab (which is the object equivalent of $LISTBUILD), it is not shown as a folder.
For example, see the DiagnosesAsLB property, which is included in the Patients sample to illustrate this point.
-
If a class is not accessible from the base class via cascading dot syntax, it is not shown.
For example, the Architect does not display DeepSee.Study.PatientDetailsOpens in a new tab or DeepSee.Study.PatientEncounterOpens in a new tab.
-
The Architect displays properties inherited from superclasses. (The sample does not demonstrate this.)
All core cube elements are based either on a source property or on a source expression (which is an ObjectScript expression) that can use properties of any class.
The Architect provides a useful view of the class properties, which makes it very easy to create DeepSee elements based on those properties. It is important, however, to know that although this view provides a convenient way to access some properties, you can also use a source expression to access any data. These source expressions are evaluated when the cube is built and thus do not affect your runtime performance.
Model Viewer
The center area is the Model Viewer, and it shows the current contents of the cube. For example:
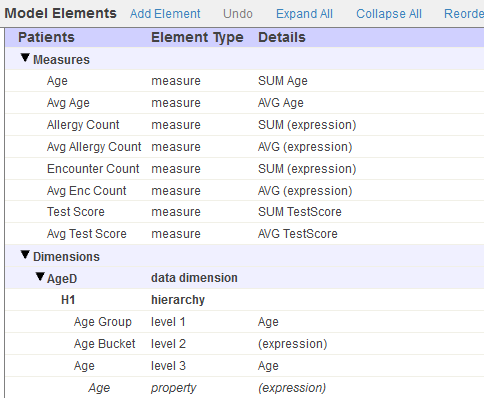
You can resize this area. To do so, drag the vertical divider on the left edge of this area.
The links at the top include Add Element, which you can use to add measures, dimensions, and other items to the cube. In the area below the links, you can select items for editing, including the cube itself in the first row. You can also delete an item by clicking the X button in the row for that item.
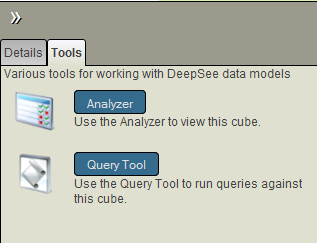
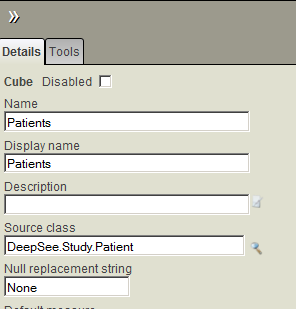
Details Area
The right area is the Details Area, and it shows details for the element that is currently selected in Model Viewer (if any), or for the cube (if nothing is selected).
For example:
To hide this area, click the Hide Details button  . If you do so, the Model Viewer is widened.
Then, to display this area again, click the Show Details button  .
.
In this area, you primarily work on the Details tab. The Tools tab provides quick access to other tools, not documented this book. This tab looks like this: