Creating Dashboards
This chapter describes how to create dashboards that display Ensemble business metrics. It contains the following topics:
For information on defining Ensemble business metrics, see Developing Ensemble Productions.
Introduction to Dashboards
A dashboard displays business metrics or other data (such as DeepSee pivot tables). InterSystems dashboards are web-based. You can display them with the Dashboard Viewer (which is a web page) or you can embed them in Zen pages.
To see the dashboards provided in the ENSDEMO namespace, do the following:
-
In the Management Portal, switch to the ENSDEMO namespace.
-
Click DeepSee > User Portal from the Home page. This launches the DeepSee User Portal, which is a separate web-based application.
Note:For your end users, you would probably provide a direct link to the User Portal page.
You then see the DeepSee User Portal (which is intended for general use, despite its specific name). In ENSDEMO, the User Portal looks like this:
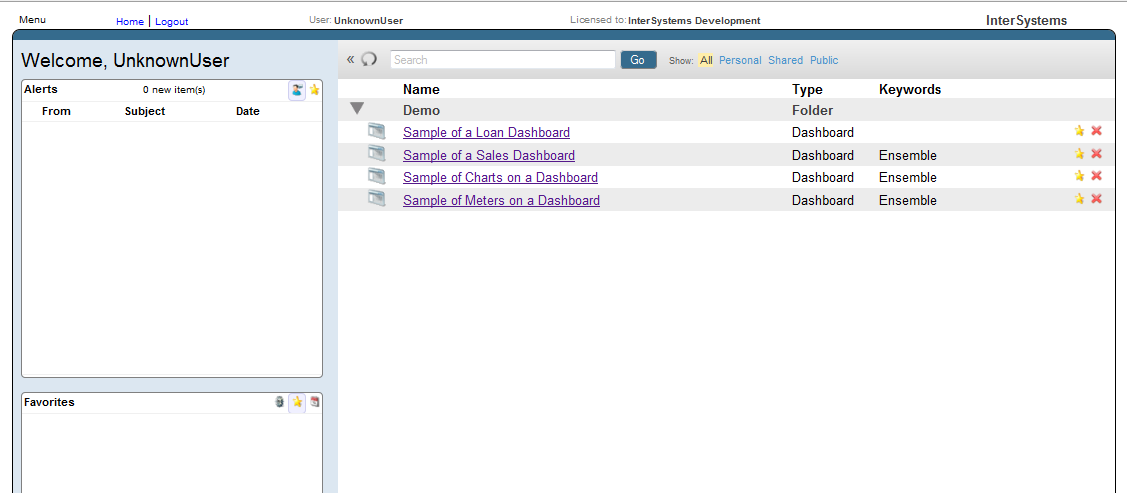
The right area of this page lists all dashboards to which you have access. (For workflow users, the right area also includes the Workflow Inbox, with which users display and manage their workflow tasks.)
The left area displays items such as the following:
-
Alerts (messages from other users of the User Portal). These are unrelated to Ensemble alerts.
-
List of recently accessed dashboards.
-
List of dashboards marked as favorites.
The DeepSee End User Guide explains how to use this user interface and how to work with dashboards.
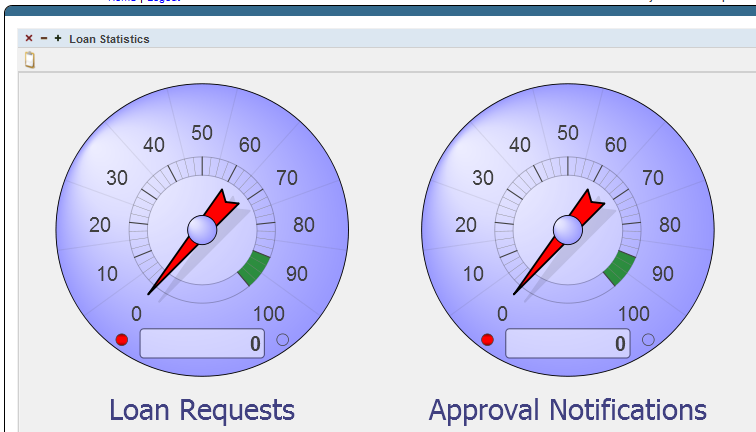
If you click the link for a dashboard in the User Portal, the Dashboard Viewer then displays the dashboard. The following shows a simple example:
You create dashboards in the User Portal. If you want users to have access to the User Portal but not have the ability to create their own dashboards, see the chapter “Setting Up Security” in the DeepSee Implementation Guide.
You can instead embed individual dashboards in Zen pages. In this case, the users would not need the User Portal. For information, see “Accessing Dashboards from Your Application” in the DeepSee Implementation Guide.
Creating Dashboards
The following is an example procedure of how to create a simple dashboard in DeepSee. Note that not all options you see are described in these steps. (See Creating DeepSee Dashboards for full details.)
-
In the ENSDEMO namespace, start the Demo.Dashboards.Production from the Production Configuration page (Ensemble > Configure > Productions).
-
In the Management Portal, click DeepSee, click User Portal, and then click Go.
-
From the User Portal, click New Dashboard on the Menu.
The system displays a dialog box that prompts you for basic information about the new dashboard.
-
For Dashboard Name, type the name of the dashboard.
-
Optionally provide values for the following options:
-
Folder — Specifies the folder, if any, to which the dashboard belongs. You can either type a folder name or select an existing folder. Use the slash character (/) to specify a subfolder. For example, you can enter the following for Folder:
My Folder/My SubfolderFolders organize the dashboards as seen in the User Portal.
-
Dashboard Title — Specifies the title of the dashboard.
If you specify a title, the main area of the User Portal displays the title of the dashboard. Otherwise, it displays the name of the dashboard.
-
Public — Specifies whether this dashboard is displayed in the User Portal main area.
(Even if the dashboard is not marked as public, you can access it via Main > Open. Also, you can find it in the User Portal by using the Find option. See the DeepSee End User Guide.)
-
Locked — Enables you to temporarily prevent changes to this dashboard. If you select this option, you cannot edit the dashboard again unless you first clear the Locked option again.
-
Dashboard Owner — Optionally specifies the Caché user who owns this dashboard. If a dashboard has an owner, then only the owner can specify the Access Resource value for the dashboard; see the next item.
-
Access Resource — Optionally specifies the Caché resource that is used to control access to this dashboard. See the DeepSee Implementation Guide.
-
Keywords — Lists any keywords or phrases to help you find this dashboard later. Enter one keyword or phrase per line; that is, each line you enter here is treated as a single keyword.
These keywords are displayed in the User Portal.
-
-
Click OK.
The system creates, saves, and displays the dashboard, which is initially empty.
-
Click Add New Widget on the Menu and then click Bar Chart on the left from the list of Pivots and Charts.
-
Click the magnifying glass to the right of the Data source.
-
Click Business Metrics on the left of the Finder Dialog.
-
Click Demo.Dashboard.Production and then SalesMetrics to choose this metric as the data source. Click OK to add this widget to the dashboard. You now see this widget in the dashboard work space. Resize the widget graphic out so you can see what it contains.
-
Click Save on the Menu to save the dashboard.
-
Click Home to see the list of dashboards and then click the dashboard name you just added to view it.
-
Click the clipboard icon at top left of the bar chart, to edit the appearance of the widget you added using the Widget Designer.
-
Click the Data Properties tab.
-
Click the plus sign icon at right, click Sales in the Data Value list, and click OK.
-
Click the plus sign icon again, click Units in the Data Value list, and click OK.
-
Click Save on the Menu.
-
Refresh the browser to see the display change as the production runs.
Location of Dashboard Definitions
When you create a dashboard, its definition is visible in the Studio Workspace window, within the Other folder. You can export and import this definition as you do with other items in Studio.
A dashboard definition is not a class definition but can be copied and pasted into a special container class if needed; this container class can contain multiple dashboards and other items. For details, see “Packaging DeepSee Elements into Classes” in the DeepSee Implementation Guide.
For More Information
InterSystems dashboards are documented more fully within the DeepSee documentation. See the following books:
-
Creating DeepSee Dashboards describes how to create and modify dashboards.
-
DeepSee End User Guide describes how to work with the User Portal.