Monitoring All Namespaces
This chapter describes how to monitor productions in all namespaces. It contains the following topics:
-
Monitoring Multiple Productions with the Enterprise Monitor to monitor multiple namespaces across multiple instances of Ensemble
General Notes
For background information, see the chapter “Concepts.”
For information on starting and stopping productions, see “Managing Ensemble.” Note that for a live, live, deployed production, InterSystems recommends that you use the auto-start option, which is described in that book.
If a production is Suspended or Troubled, see “Correcting Production Problem States,” in the next chapter.
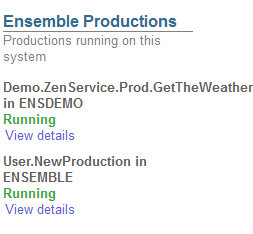
Viewing Summaries for Active Productions
When you select any option in the Ensemble menu, the right side of the page displays summary information about the productions, as follows:
Using the Ensemble System Monitor
The Ensemble System Monitor page provides a high-level view of the state of your system, across all namespaces. (It displays Ensemble information combined with a subset of the information shown on the System Dashboard page, which is provided for the users of Caché.)
To access this page in the Management Portal, select Ensemble > Monitor > System Monitor.
This page displays tables of information, described in the following subsections.
Also see “General Notes,” earlier in this chapter.
Ensemble Throughput
This table provides information about the throughput of productions in all namespaces. The table lists the following values:
-
Productions Running — Number of productions that are currently running.
-
Productions Suspended or Troubled — Number of productions that are currently suspended or troubled.
If a production is Suspended or Troubled, see “Correcting Production Problem States,” in the next chapter.
-
Incoming Messages in Last 30 Seconds — Number of messages received by business services in the last 30 seconds.
-
Last Incoming Message — Date and time of last message received by any business service.
-
Outgoing Messages in Last 30 Seconds — Number of messages processed by business operations in the last 30 seconds.
-
Last Outgoing Message — Date and time of last message processed by any business operation.
Ensemble Jobs
This table provides information about the jobs associated with the currently running productions in all namespaces. The table lists the following values:
-
Total System Processes — Number of system processes that are currently active, including processes that are not specifically associated with Ensemble productions.
If you click Total System Processes and then click the link at the bottom of the page, Ensemble displays the Processes page. For information on this page, see “Controlling Caché Processes” in the chapter “Managing Caché” in the Caché System Administration Guide.
-
Active Ensemble Jobs — Number of Ensemble jobs that are currently active.
-
Visiting Ensemble Jobs — Number of jobs outside of Ensemble that are currently invoking Ensemble code.
-
Most Active Processes — Displays a table of the processes that have the highest number of recently executed commands, across all namespaces, including processes that are not specifically associated with Ensemble productions. PID is the process ID, and Commands is the number of recently executed commands.
Also see “Diagnosing Problems with Jobs” in the next chapter.
System Time
This table provides the same information as in the System Time table of the System Dashboard page. See “Monitoring System Dashboard Indicators” in the chapter “Monitoring Caché Using the Management Portal” in the Caché Monitoring Guide.
If you click a row in this table and then click the link at the bottom of the page, Ensemble displays the System Dashboard page.
System Usage
This table provides a subset of the information in the System Usage table of the System Dashboard page. See “Monitoring System Dashboard Indicators” in the chapter “Monitoring Caché Using the Management Portal” in the Caché Monitoring Guide.
If you select a row in this table and then click the link at the bottom of the page, Ensemble displays one of the following pages, as appropriate for the row you selected:
-
Databases
-
Journals
-
Locks
Ensemble Queues
This table provides information about Ensemble queues in all namespaces. The table lists the following values:
-
Active Queues — Count of currently active Ensemble queues.
-
Most Active Queues — Displays a table of the queues that have the largest number of unprocessed messages. In this table, Messages is the count of messages in the given queue.
Also see “Diagnosing Problems with Queues” in the next chapter.
Errors and Alerts
This table provides information about errors and alerts. The table lists the following values:
-
Serious System Alerts — Number of serious system-level alerts that have been raised.
-
Ensemble Alerts — Number of serious Ensemble alerts that have been raised.
-
Ensemble Errors — Number of application errors that have been logged.
For information on configuring a production to send alerts, see “Configuring Alerts” in Configuring Ensemble.
Licensing
This table provides the same information that is shown in the Licensing table of the System Dashboard page. See “Monitoring System Dashboard Indicators” in the chapter “Monitoring Caché Using the Management Portal” in the Caché Monitoring Guide.
If you select a row in this table and then click the link at the bottom of the page, Ensemble displays the License Usage page.
Task Manager
This table provides the same information that is shown in the Task Manager table of the System Dashboard page. See “Monitoring System Dashboard Indicators” in the chapter “Monitoring Caché Using the Management Portal” in the Caché Monitoring Guide.
If you select a row in this table and then click the link at the bottom of the page, Ensemble displays the Upcoming Tasks page.
Monitoring Multiple Productions with the Enterprise Monitor
The Enterprise Monitor displays the overall status of multiple running productions. These productions can be running on different namespaces within the same instance of Ensemble or can be running on multiple instances of Ensemble. You can display the Production Monitor or the Ensemble management portal for any of the productions being monitored. The monitored productions can be running in different namespaces on the same Ensemble instance, running on multiple Ensemble instances on the same system, running on multiple systems, or running on any combination of these.
This section contains the following topics:
Configuring the Enterprise Monitor
The Enterprise Monitor runs in its own namespace with a special production that gets the status of the monitored systems. To configure an Enterprise Monitor, you perform the following steps:
-
Create a namespace for the Enterprise Monitor or choose to use an existing namespace for it. The following steps are done in this namespace.
-
Define credentials that provide access to the systems that you will be monitoring.
-
Configure Enterprise Systems, defining a new connection for each system that you are monitoring. Optionally, specify a queue threshold for each system. For details on configuring Enterprise Systems, see “Identifying Enterprise Systems for Viewing and Monitoring” in Configuring Ensemble Productions.
-
Optionally, specify Enterprise Monitor Roles. If the user using the Enterprise Monitor has one of these roles, the user only monitors the configuration items that have one of the specified categories. For details, see “Configuring and Using Enterprise Monitor Roles”
-
Create a production for the special Enterprise Monitor service. The class of this production must derive from the Ens.Enterprise.ProductionOpens in a new tab class. You can create the production in Studio or create it using the management portal and then edit in Studio as follows
-
In Studio, open the class that defines the production running in the Enterprise Monitor namespace.
-
Replace the class Ens.ProductionOpens in a new tab with Ens.Enterprise.ProductionOpens in a new tab. For example, if the class definition is
Class EMon.EntMonitorProd Extends Ens.Production
Edit it so that the class extends Ens.Enterprise.ProductionOpens in a new tab so that it appears as:
Class EMon.EntMonitorProd Extends Ens.Enterprise.Production
-
Compile the class.
-
-
Add the Ens.Enterprise.MonitorServiceOpens in a new tab business service to the production and enable it.
-
Start the production.
-
Select Ensemble, Monitor, and Enterprise Monitor to display the Enterprise Monitor. Note that this menu item is only visible if you have configured Enterprise Systems in the current namespace.
Using the Enterprise Monitor
You must have the following permissions to use the Enterprise Monitor:
-
Use access to %Ens_Dashboard
-
Use access to %Ens_Portal, or use access to the resource required to run the web application that corresponds to the namespace associated with the Enterprise Monitor
-
Read access to the database that corresponds to the production associated with the Enterprise Monitor
For more information, see Controlling Access to Management Portal Functions.
The Enterprise Monitor displays a line for each monitored system. For example, the following Enterprise Monitor is monitoring four systems:
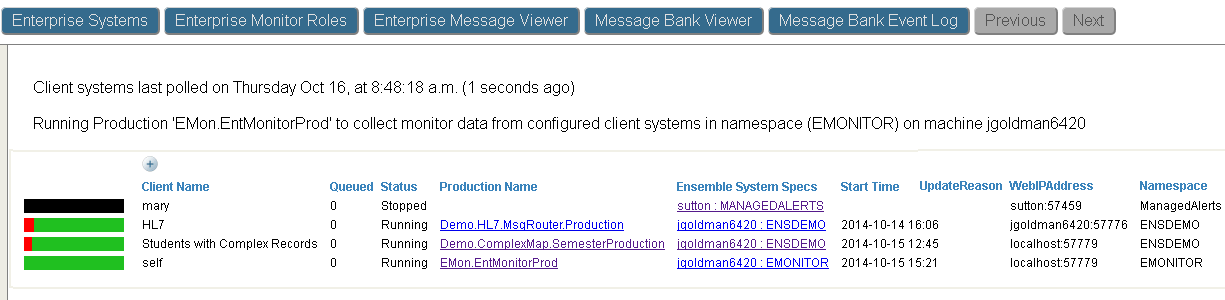
The Enterprise Monitor displays the following information for each system:
-
Bar graph—Indicates the status of the configuration items of the production. The green, red, and yellow indicate the percentage of the items in each state. Green indicates the items that are active and running correctly; yellow indicates the items that are inactive; and red indicates the items that have encountered an error. If you hover over the bar graph, the pop-up text displays the number of items in each state.
-
Client Name—Name defined when configuring Enterprise Systems to identify the system in the Enterprise Monitor.
-
Queued—Specifies the total number of messages currently waiting in queues. If you have set the queue threshold and the number of messages exceeds the threshold, the number is displayed in red. If the number exceeds 85% of the threshold, it is displayed in yellow. If the number is below 85% of the threshold, it is displayed in green. If no threshold is specified, the queue number is displayed in black.
-
Status—Indicates the status of the productions: running, stopped, suspended, or troubled.
-
Production Name—Displays the production name. If you click on this link, the Enterprise Monitor opens the Production Configuration page on this system.
-
Ensemble System Specs—Displays the system name and namespace of the system. If you click on this link, the Enterprise Monitor opens the Ensemble management portal on the system.
-
Start Time—Displays the date and time that the Ensemble instance was started if it is currently running.
-
UpdateReason—Specifies the reason that the production configuration was last updated.
-
WebIPAddress—Specifies the system name and port number.
-
Namespace—Specifies the namespace of the system.
If you click on an item in the Enterprise Monitor that is not a link, the Enterprise Monitor displays the production monitor for that system. For information on the Production Monitor, see Monitoring a Production.
Configuring and Using Enterprise Monitor Roles
Enterprise Monitor Roles allow you to limit the production components that are visible in the Enterprise Monitor based on the roles of the current user and the categories specified in the production configuration for the component. When a user displays the Enterprise Monitor, it checks if the user has any roles specified in the Enterprise Monitor Roles. If none of the roles match, the Enterprise Monitor displays information about all the components in the productions. If one or more of the roles match, the Enterprise Monitor displays information about components that have one of the specified categories.
To add new roles or edit an existing role, select Enterprise Monitor Roles on the Enterprise Monitor. The following illustrates the Enterprise Monitor Roles page:
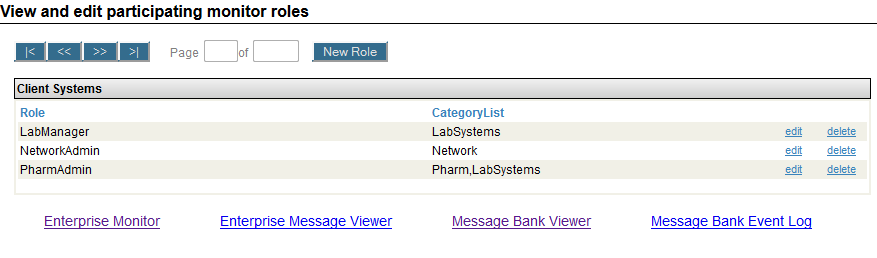
To add a new role, select New Role. To edit or delete a role, select “edit” or “delete”. When you enter the role and category, the form does not list the existing roles or categories. You must know these and enter them as text. Once you have entered a category, it is available as a checkbox when you add or edit a role.
Troubleshooting the Enterprise Monitor
If the Enterprise Monitor is not working, this troubleshooting list may help you resolve the problem:
-
If the Enterprise Monitor cannot get access from any monitored system and displays the message “Not currently collecting monitor data from configured client systems - No Message Bank or Enterprise Production is running in this namespace (EMONITOR) on machine jgoldman6420”:
Ensure that the production in the namespace is running. You will get this message if it is not running.
-
If the Enterprise Monitor appears to be working correctly but it is displaying the message “Not currently collecting monitor data from configured client systems - No Message Bank or Enterprise Production is running in this namespace (EMONITOR) on machine jgoldman6420”:
The production in the namespace must have a class that extends the Ens.Enterprise.ProductionOpens in a new tab class. If you create a new production using the Ensemble portal, it creates a production that extends Ens.ProductionOpens in a new tab. To fix this problem, edit the production in Studio and change the class that it extends. Then compile the class and stop and restart the production.
-
If the Enterprise Monitor does not display an error message but the clients are not being polled and the data is not being updated:
Ensure that the production contains the Ens.Enterprise.MonitorServiceOpens in a new tab business service and that it is enabled.