Using Callback Charts in Zen Reports
Zen reports callback charts reproduce the functionality of Zen charts in Zen reports. All of the chart types and a majority of chart properties available in Zen are also supported by Zen reports callback charts. For information on Zen charts, see the “Zen Charts” chapter of the book Using Zen Components, especially the section “Types of Chart”, which describes all the chart types supported by Zen and Zen reports. Documentation for an earlier charting implementation, called XPath charts, is available in the section “Using XPath Charts in Zen Reports” in this book.
Topics include:
Zen Reports Chart Properties
A small number of properties are handled differently by Zen pages and Zen reports. In general, because Zen reports are not interactive, callback charts do not support Zen chart properties that rely on the interactive nature of Zen applications.
The following table lists properties that are unique to Zen reports, or behave differently from their Zen page equivalents.
| Attribute | Description |
|---|---|
| bandLeft | Decimal value. If defined, the chart displays a vertical colored band on the plot area covering the range lower than this value. bandLeftStyle defines the style of this band. bandLeft and bandRight are applicable only to charts that have a value axis as the x axis, such as <xyChart>. |
| bandLeftStyle | SVG CSS style definition for the band defined by bandLeft. |
| bandRight | Decimal value. If defined, the chart displays a vertical colored band on the plot area covering the range higher than this value. bandRightStyle defines the style of this band. bandLeft and bandRight are applicable only to charts that have a value axis as the x axis, such as <xyChart>. |
| bandRightStyle | SVG CSS style definition for the band defined by bandRight. |
| ongetData |
Specifies a callback method which provides data for Zen reports callback charts. Zen pages also support ongetData, but the method you supply is different for Zen reports. See the section “Providing Data for Zen Report Charts” following this table. |
| ongetLabelX |
Specifies a callback method which provides labels for the x-axis. Zen pages also support ongetLabelX, but the method you supply is different for Zen reports. See the section “Zen Reports Callback Methods” following this table. |
| ongetLabelY |
Specifies a callback method which provides labels for the y-axis. Zen pages also support ongetLabelY, but the method you supply is different for Zen reports. See the section “Zen Reports Callback Methods” following this table. |
| ongetSeriesName |
Specifies a callback method which the chart calls to get names for the data series. The chart passes the method an argument that contains the 0-based ordinal number of the series. See the section “Zen Reports Callback Methods” following this table. |
| passChartObject | Controls whether the chart passes the chart object to the ongetData callback method. Should be used only to provide backward compatibility for code written for earlier versions that did not pass the chart object.
This attribute has the underlying data type %ZEN.Datatype.booleanOpens in a new tab. See “Zen Reports Attribute Data Types.” |
| seriesCount | In Zen pages, you must provide values for the property seriesCount if the chart does not get its data from a data controller. Zen reports do not use data controllers, and handle seriesCount differently. If you do not specify this parameter, it is calculated from the data provided by the ongetData callback method. If you do supply a value, the chart uses it to determine how much of the available data to use in the chart. |
| seriesSize | In Zen pages, you must provide values for the properties seriesSize if the chart does not get its data from a data controller. Zen reports do not use data controllers, and handle seriesSize differently. If you do not specify this parameter, it is calculated from the data provided by the ongetData callback method. If you do supply a value, the chart uses it to determine how much of the available data to use in the chart. |
Zen Reports Charts Callback Methods
Zen reports charts have several attributes that specify callback methods used to provide information to the chart. ongetData, ongetLabelX, and ongetLabelY are also supported by Zen pages, but ongetSeriesName is unique to Zen reports. See “Plot Area” for a discussion of ongetLabelX and ongetLabelY in Zen pages. The section “Providing Data for Zen Reports Charts” discusses ongetData in detail.
Callback methods for Zen pages are written in JavaScript and executed on the client. Callback methods for Zen reports are written in ObjectScript or another suitable language and executed on the server. All of these methods also accept the chart object as a second parameter, which enables the callback method to use information from the chart. You can set passChartObject="false" to provide backward compatibility with callback methods written for previous versions that did not pass the chart object.
The following code example illustrates all of the callback methods. The methods for ongetLabelX and ongetLabelY use the chart object to determine whether the chart is pivoted and supply labels to the correct axis.
/// This XML defines the logical contents of this report.
XData ReportDefinition [ XMLNamespace = "http://www.intersystems.com/zen/report/definition" ]
{
<report xmlns="http://www.intersystems.com/zen/report/definition"
 name="test" runonce="true">
</report>
}

/// This XML defines the display for this report.
/// This is used to generate the XSLT stylesheets for both HTML and XSL-FO.
XData ReportDisplay [ XMLNamespace = "http://www.intersystems.com/zen/report/display" ]
{
<report xmlns="http://www.intersystems.com/zen/report/display"
 name="test">
 <document width="8.5in" height="11in"
  marginLeft="1.25in" marginRight="1.25in"
  marginTop="1.0in" marginBottom="1.0in"
  headerHeight="1in" >
  </document>

<body>
<cpercentbarChart
    id="chart1b"
    appearance="2D"
    chartPivot="false"
    ongetSeriesName ="getSeriesName"
    valueLabelsVisible="true"
    ongetLabelX="getSeriesNameX"
    ongetLabelY="getSeriesNameY"
    width="500" height="400"
    seriesCount="4" seriesSize="3"
    ongetData="getChartData" >
    <yAxis majorGridLines="true"></yAxis>
    </cpercentbarChart>
</body>
</report>
}

/// Get chart data
Method getChartData(ByRef data, chartObject)
{
    for i=1:1:3 Set data(1-1,i-1) = $LI($LB( 34, 18, 27),i)
    for i=1:1:3 Set data(2-1,i-1) = $LI($LB( 43, 14, 24),i)
    for i=1:1:3 Set data(3-1,i-1) = $LI($LB( 43, 16, 27),i)
    for i=1:1:3 Set data(4-1,i-1) = $LI($LB( 45, 13, 34),i)
}

/// Get X axis label name
Method getSeriesNameX(value, chartObject)
{
    if chartObject.chartPivot {
        quit value
    }
    else {
        quit $LI($LB(1991,1992,1993,1994),value+1)
    }
}

/// Get Y axis label name
Method getSeriesNameY(value, yAxisNo, chartObject)
{
    if chartObject.chartPivot {
        quit $LI($LB(1991,1992,1993,1994),value+1)
    }
    else {
        quit value
    }
}

/// Get series name
Method getSeriesName(sno, chartObject)
{
    quit $LI($LB("Oats","Barley","Wheat"),sno+1)
}
Providing Data for Zen Report Charts
The primary difference between charts in Zen reports and Zen pages is the way they provide data to the chart. Both use the ongetData attribute to specify a callback method that supplies the data. Zen pages provide a callback method written in JavaScript and executed on the client, which returns an array. For more information, see the section “Providing Data for Zen Page Charts” in the book Using Zen Components. Zen reports provide a callback method written in ObjectScript or another suitable language and executed on the server. Because ObjectScript does not allow methods to return arrays, the two-dimensional, 0-based array is passed by reference and filled in by the method. In addition to the array reference, the chart object is passed to the ongetData callback method. If the method signature does not include the chart object, you get an error. You can set passChartObject="false" to provide backward compatibility with callback methods written for previous versions that did not pass the chart object.
In Zen pages, the value of the ongetData attribute is a complete JavaScript statement, such as this: ongetData="return zenPage.getChartData(series);". For this reason, you can specify the arguments to the callback method from in the chart. In Zen reports, the attribute value is simply the name of the method, such as this: ongetData="getChartData". You cannot specify arguments for the method's parameters. The parameters are filled in automatically by internal code, which is why requirements for the method signature are more stringent in Zen reports.
Note that all data acquisition and processing for the chart takes place in the ongetData callback method. For this reason, the chart content does not reflect any structure or data organization that may be present in the XData ReportDefinition or XData ReportDisplay sections of the report.
The following code samples illustrate different approaches to creating Zen reports callback charts. Both produce the same bar chart as output:
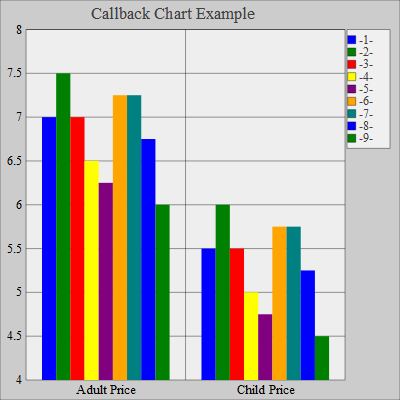
Getting Data from SQL
In the first example, the XData ReportDefinition is essentially a place holder. The real work is done in XData ReportDisplay, which defines the <cbarChart>, and in the ongetData callback method getchartdata, which uses SQL to get data from the database. The callback then uses the result set to fill the array passed by reference.
Class MyApp.getchartdata Extends %ZEN.Report.reportPage {
Parameter APPLICATION;
Parameter DEFAULTMODE = "html";
XData ReportDefinition [ XMLNamespace = "http://www.intersystems.com/zen/report/definition" ]
{
  <report xmlns="http://www.intersystems.com/zen/report/definition"
   name="test" runonce="true">
  </report>
}
XData ReportDisplay [ XMLNamespace = "http://www.intersystems.com/zen/report/display" ]
{
  <report xmlns="http://www.intersystems.com/zen/report/display"
     name="test">
    <document width="8.5in" height="11in" marginLeft="1.25in" marginRight="1.25in"
     marginTop="1.0in" marginBottom="1.0in" headerHeight="1in">
    </document>
    <body>
      <cbarChart
        plotAreaStyle="fill: #eeeeee;"
        ongetData="getchartdata"
        title="Callback Chart Example"
        height="400px" width="400px"
        seriesColorScheme="solid"
        ongetLabelX="getName" >
        <yAxis majorGridLines="true" minValue="4" />
        <xAxis majorGridLines="true" />
      </cbarChart>
    </body>
  </report>
}
Method getName(val, yseries)
{
  quit $LG($LB("Adult Price","Child Price"),(val+1))
}
Method getchartdata(ByRef var, chart)
{
  SET myquery =
    "SELECT TheaterName,AdultPrice,ChildPrice FROM Cinema.Theater ORDER BY TheaterName"
  SET tStatement = ##class(%SQL.Statement).%New()
  SET tStatement.%ObjectSelectMode=1
  SET tStatus = tStatement.%Prepare(myquery)
  SET rset = tStatement.%Execute()
  Set Count=0
  WHILE rset.%Next()
  {
    Set var(Count,0)=rset.AdultPrice
    Set var(Count,1)=rset.ChildPrice
    Set Count=Count+1
  }
  quit $$$OK
}
}
Getting Data from XML
In the next example, the XData ReportDisplay block and the method getName are identical to the previous example, and have been deleted. This example takes an approach similar to that used by the older, XPath charts. The XData ReportDefinition uses SQL to get data from the database, and uses the result set to create an intermediate XSLT document. The callback method accesses that document and stores data from it in the array. For more information, see “Evaluating XPath Expressions” in the book Using Caché XML Tools.
Include (%occSAX, %occXSLT)
Class MyApp.CBarChartXSLT Extends %ZEN.Report.reportPage
{
Parameter APPLICATION;
Parameter DEFAULTMODE = "html";
XData ReportDefinition [ XMLNamespace = "http://www.intersystems.com/zen/report/definition" ]
{
<report xmlns="http://www.intersystems.com/zen/report/definition"
 name="test" sql="SELECT ID,TheaterName,AdultPrice,ChildPrice
  FROM Cinema.Theater ORDER BY TheaterName" >
  <group name="Theater" breakOnField="TheaterName">
  <attribute name="TheaterName" field="TheaterName" />
  <attribute name="TheaterID" field="ID" />
  <element name="Adult" field="AdultPrice" />
  <element name="Child" field="ChildPrice" />
  </group>
</report>
}
///
/// XData ReportDisplay and Method getName deleted
///
Method getchartdata(ByRef var, chart)
{
  Set tSC=$$$OK
    do
    {
      Set tSC=##class(%XML.XPATH.Document).CreateFromFile(..xmlfile,.tDoc)
      if $$$ISERR(tSC) {Do $System.OBJ.DisplayError(tSC) Quit}
      Set tSC=tDoc.EvaluateExpression("/test","Theater",.tResults)
      if $$$ISERR(tSC) {Do $System.OBJ.DisplayError(tSC) Quit}
      For tI=1:1:tResults.Count()
      {
        Set tResult=tResults.GetAt(tI)
        Set index=$i(var(0))
        while (tResult.Read())
        {
        if (tResult.Name="Adult")
        {
          do tResult.Read()
          Set var(index-1,0)=tResult.Value
        }
        if (tResult.Name="Child")
        {
          do tResult.Read()
          Set var(index-1,1)=tResult.Value
          Set index=$i(var(0))
        }
      }
    }
  } while(0)
}
}
Xmlfile
xmlfile is a Zen report property that contains a string which is the fully qualified name of the generated file containing XML. It should not be set by the user. It can be used by callback charts as a source of data that can be manipulated through the XML XPATH and XSLT processors. xmlfile is defined when processing takes place on the server. It is not defined when processing takes place on the browser. The section Setting Zen Report Class Properties from the URI includes an overview of when processing occurs on the browser or the server.
The code sample in the section Getting Data from XML illustrates the use of xmlfile as a source of data.