Displaying Zen Report Data
This topic describes the elements that display the visual content of the report. Many of these elements can be a child of <pageheader> <pagefooter>, <pagestartsidebar>, <pageendsidebar>, <body>, <block>, <div>, <group>, or <table>.
The display elements are:
-
<barcode> — Adds a barcode to the generated PDF. Not supported for HTML.
-
<barcodeOptions> — Adds options to a <barcode>.
-
<block> — Group of items to be handled inline
-
<bidioverride> — Adds an <fo:bidi-override> element to the generated XSL-FO, and a <bdo> element to generated HTML.
-
<br/> — Line break within a block
-
<container> — Group of items, usually layered over a background image
-
<div> — Group of items to be handled as a block
-
<footer> — Group of items for a page footer
-
<group> — Group of items for repeated actions
-
<header> — Group of items for a page header
-
<img> — Image
-
<inline> — Inline text styling
-
<inlinecontainer> — Adds an <fo:inline-container> element to the generated XSL-FO.
-
<item> — Data value
-
<line> — Horizontal line between blocks
-
<link> — Link to another URI
-
<list> — Simple, bulleted, or numbered list of items
-
<p> — Text string of any length
-
<pagebreak> — Page break
-
<small-multiple> — Series of graphic elements repeated on the page.
-
<table> — Table
-
<timeline> — A graphic summary of episodes
In addition, Zen reports supports a number of elements that let you create charts. Zen reports callback charts replicate the charting capability provided by charts in Zen pages. The section “Zen Charts” in the chapter “Using Zen Components” describes all the types of charts supported by both Zen pages and Zen reports. The section “Zen Reports Callback Charts” in this book discusses topics specific to charts in Zen reports.
Report Display Attributes
Each of the display elements listed in this chapter has the attributes described in the following table. It may have other attributes also.
| Attribute | Description |
|---|---|
| class |
CSS style class to apply to the element. Style classes can be defined by the <class> element in addition to those given by the standard style sheet. For more information, see the discussion following this table. |
| htmlstyle | Same as the style attribute described in this table, but the styles specified using the htmlstyle attribute apply to HTML output only. |
| selectstylecond |
Comma-separated list of ObjectScript expressions. At runtime, the Zen report evaluates the selectstylecond expressions from left to right. The style in selectstylelist that corresponds to the first true condition in selectstylecond is applied to the display element. For details, see “Conditionally Applying CSS Styles” following this table. |
| selectstylelist |
Comma-separated list of CSS statements to use with selectstylecond. |
| style |
Similar to the style attribute in CSS, this attribute may provide a semicolon-delimited list of attribute:value pairs. For example: style="fill:yellow;font-size:6pt;" If you apply a style to a container such as <block>, it might not apply to every node within the container. If you have difficulty with this, try applying the style attribute to the lower-level node, such as <item>. |
| stylecall |
The name of an <xsl:template> to execute. The template must be defined in an XData HtmlXslt or XData XslFoXslt block (or both) in the same Zen report class. See styleparamNames and styleparams in this table, and the section “Calling XSLT Templates to Apply Styles.” |
| styleparamNames |
Semicolon-separated list of names of <xsl:param> arguments for an <xsl:template> to invoke for this <item>. See stylecall and styleparams in this table, and the section “Calling XSLT Templates to Apply Styles.” |
| styleparams |
Semicolon-separated list of expressions that provide values for the <xsl:param> arguments defined for an <xsl:template> to invoke for this <item>. These expressions can be literal values, node sets, XPath expressions, or XSLT function calls. Anything that is valid as a value for <xsl:with-param> in XSLT is valid in styleparams. See stylecall, styleparamNames in this table, and the section “Calling XSLT Templates to Apply Styles.” |
| template |
Name of the template that specifies this element. The format is: templateClass:templateName Where:
If the template name starts with exclamation point (!) it is interpreted as a COS runtime expression. To create a template, see the “Using Zen Report Templates” section in the chapter “Building Zen Report Classes.” |
| width |
HTML length value that defines the element’s width. The exact meaning depends on the individual element. If widths are omitted, the PDF rendering tool can produce unexpected results. "2in", "5cm", "12px", "14pt", "3em", or "75%" are all valid formats for HTML length values. A percentage is relative to the container for the element that uses the width attribute. |
| xslfostyle | Same as the style attribute described in this table, but the styles specified using the xslfostyle attribute apply to the XSLFO stylesheet for PDF output only. |
When specifying a value for the class attribute, do not include the element name that is given when creating the class. Thus, if you have a style class named table.myTable that you want to use, in the <report> specify:
<table class="myTable">
The following <table> element uses the class attribute to apply the table.grid style to a table in a Zen report:
<table class="grid" group="Step">
 <item width="0.8in" field="@Number" />
 <item width="0.8in" field="./AllSet" />
 <item field="./DemoText" />
</table>
Parent elements propagate their class attribute values to children that do not have a class specified. So if you define table.myTable, th.myTable, and td.myTable, you only need to give the <table> element a class attribute. You can even put a class attribute on the <body> element to give a class for every element in the report (at least, for those that do not override it with a class attribute of their own).
The class value may consist of multiple class names separated by space characters, as in the following example:
<document width="8.5in" height="11in"
          marginLeft="1.25in" marginRight="1.25in"
          marginTop="1.0in" marginBottom="1.0in">
  <class name="p.class1">
    <att name="background-color" value="red" />
  </class>
  <class name="p.class2">
    <att name="color" value="white" />
  </class>
</document>
<body>
  <p class="class1 class2">Can CSS use two classes?</p>
</body>
For descriptions of predefined style classes for Zen reports, see:
Whether or not you use the predefined styles, you may define custom style classes using the <class> element and apply them to elements in a Zen report using the class attribute.
Conditionally Applying CSS Styles
The simplest style attribute for a display element is style. This provides a semicolon-delimited list of CSS styles to apply to the display element.
It is possible for a display element to define a list of conditions to define a list of styles. The selectstylecond attribute is a comma-separated list of ObjectScript expressions. These expressions may not contain private variables, but you may use the special variable %report to indicate the report class, and dot syntax with %report to reference properties of the Zen report class. At runtime, the Zen report evaluates the selectstylecond expressions from left to right. The style in selectstylelist that corresponds to the first true condition in selectstylecond is applied to the display element.
In the following example, when the Month property has the value 1, the numbers are red, otherwise they are yellow:
<item special="number" width="75%"
  selectstylecond="%report.Month=1,1" selectstylelist=
  "border:none;padding-right:4px;color:red,padding-right:4px;color:yellow"/>
There are three different separators at work in the previous example:
-
A comma (,) separates list entries in the Zen report selectstylelist list. Each selectstylelist entry may consist of a list of CSS style definitions.
-
A semicolon (;) separates entries in the list of CSS style definitions within the same Zen report selectstylelist list. Each entry consists of a CSS style name and its value.
-
A colon (:) separates each CSS style name from its value.
Information contained within any style attribute takes precedence over style information given by the class.
If you use %report in aselectstylelist list in a way that relies on a property value passed as a ZENURL in the URI that invokes the report, you may see unexpected results if XSLT processing takes place in the browser. See the section “Setting Zen Report Class Properties from the URI” for more information on this issue.
<barcode>
Zen reports supports generation of barcodes with Barcode4J. Barcode support is provided by the FOP rendering engine provided with Caché which has the file barcode4j-fop-ext-complete.jar installed. Zen reports does not support barcode rendering for HTML or the RenderX PDF rendering engine.
You can simply add a barcode element to the body of the XData ReportDisplay section of a report, as illustrated by the following code fragment:
<body>
 <barcode value="hello world"/>
</body>
A more realistic scenario involves using data from the database. Given the following XData ReportDefinition:
<report xmlns="http://www.intersystems.com/zen/report/definition"
 name="MyReport" sql="Select top 10 Name From Sample.Person">
 <group name="Person">
  <!-- commas are not valid in barcode code39 -->
  <attribute field="Name" name="name"
   expression='$replace(%val,","," ")'/>
 </group>
</report>
This XData ReportDisplay outputs each name, and a barcode for the name:
<report xmlns="http://www.intersystems.com/zen/report/display"
 name="MyReport">
 <body>
  <table group="Person">
   <item field="@name" />
   <barcode field="@name" />
  </table>
 </body>
 </report>
The next code sample uses the same XData ReportDefinition, and illustrates the use of <barcodeOptions>:
<report xmlns="http://www.intersystems.com/zen/report/display"
 name="MyReport">
 <body>
  <table group="Person">
   <item field="@name" />
   <barcode field="@name" barcodeType="code128">
    <barcodeOptions>
     <![CDATA[
     <barcode:height>8mm</barcode:height>
     <barcode:module-width>0.6mm</barcode:module-width>
     ]]>
    </barcodeOptions>
   </barcode>
  </table>
 </body>
</report>
<barcode> has the following attributes:
| Attribute | Description |
|---|---|
| Conditional expressions for display | For descriptions of the attributes that allow you to conditionally display the <block> element, see the section “Conditional Expressions for Displaying Elements.” |
| Display attributes | For descriptions of style, width, class, and other attributes, see the “Report Display Attributes” section at the beginning of this chapter. |
| barcodeNamespacePrefix |
The namespace prefix for BarCode4J barcode elements in the namespace http://barcode4j.sourceforge.net/2.1/Opens in a new tab. |
| barcodeOrientation |
Specifies the orientation of the printed barcode. Possible values are: 0, 90, -90, 180, -180, 270, and -270. The default value is 0. |
| barcodeType |
The type of this barcode. See http://barcode4j.sourceforge.net/2.1/barcode-xml.htmlOpens in a new tab for information about barcode types. |
| field |
An XPath expression that provides the information rendered in the barcode. If null, value can provide the barcode message. |
| htmlErrorMessage |
A text message you can use in HTML output as a place holder for barcodes. The initial value is: "Barcode elements are only supported in PDF output." Although you can enter ordinary text for this attribute, it has the underlying data type %ZEN.Datatype.captionOpens in a new tab. See “Zen Reports Attribute Data Types.” |
| value |
The information rendered in the barcode, used only if field is null. |
<barcodeOptions>
The <barcodeOptions> element allows you to specify barcode options. It has the same syntax as the <write>element. Note the use of CDATA in the following example:
<barcodeOptions>
 <![CDATA[
 <barcode:height>8mm</barcode:height>
 <barcode:module-width>0.6mm</barcode:module-width>
 ]]>
</barcodeOptions>
<barcodeOptions> has the following attributes:
| Attribute | Description |
|---|---|
| Conditional expressions for display | For descriptions of the attributes that allow you to conditionally display the <block> element, see the section “Conditional Expressions for Displaying Elements.” |
| Display attributes | For descriptions of style, width, class, and other attributes, see the “Report Display Attributes” section at the beginning of this chapter. |
| XMLEscape |
Specifies whether the barcode uses XML escaping. If <barcodeOptions> is true, the <barcodeOptions> content is enclosed in CDATA syntax; if false it is not. This attribute has the underlying data type %ZEN.Datatype.booleanOpens in a new tab. See “Zen Reports Attribute Data Types.” |
See the Barcode4j documentationOpens in a new tab at sourceforge.netOpens in a new tab for information on filling out <barcodeOptions> for a specific barcodeType.
<block>
The <block> element renders all of its child elements sequentially. The output becomes a <span> in XHTML and an <inline> in XSL-FO. It can be used anywhere in the <report>, but it is most useful as a container within a <table>. In general, a <table> treats every child element as a new row or column, so the <block> element can be used to group multiple elements into a single row or column. For the list of elements that <block> can contain, see the beginning of this chapter, “Displaying Zen Report Data.”
<block> has the following attributes.
| Attribute | Description |
|---|---|
| Conditional expressions for display | For descriptions of the attributes that allow you to conditionally display the <block> element, see the section “Conditional Expressions for Displaying Elements.” |
| Display attributes | For descriptions of style, width, class, and other attributes, see the “Report Display Attributes” section at the beginning of this chapter. |
| caption |
(Optional) Caption text for this block. Although you can enter ordinary text for this attribute, it has the underlying data type %ZEN.Datatype.captionOpens in a new tab. See “Zen Reports Attribute Data Types.” |
| id | Optional identifier. If present, it can be used to retrieve this element in server-side code, by calling the %GetComponentById(id) method. |
<bidioverride>
The <bidioverride> element adds an <fo:bidi-override> element to the generated XSL-FO. It is used to override the direction of text as determined by the Unicode Bidirectional Algorithm, to correctly render text for different scripts in mixed-language documents.
Here is an example:
<div> <bidioverride direction="rtl" unicode-bidi="bidi-override" >
<inline>Normal text</inline> </bidioverride> </div>
It produces the following output:

Practical uses for <bidioverride> include cases where text includes text written in a different direction, and rendering of European numbers in Hebrew or Arabic text.
Note that an <fo:bidi-override> cannot contain an <fo:block>, hence the use of <inline>. The appendix “Generated XSL-FO and HTML” lists which Zen reports elements generate block and inline XSL-FO output.
<bidioverride> has the following attributes:
| Attribute | Description |
|---|---|
| Conditional expressions for display | For descriptions of the attributes that allow you to conditionally display the <block> element, see the section “Conditional Expressions for Displaying Elements.” |
| Display attributes | For descriptions of style, width, class, and other attributes, see the “Report Display Attributes” section at the beginning of this chapter. |
| direction |
Specifies the text direction. Possible values:
|
| unicode-bidi |
Specifies override behavior. Possible values:
|
| id | Optional identifier. If present, it can be used to retrieve this element in server-side code, by calling the %GetComponentById(id) method. |
<br/>
The <br/> element inserts a line break within the current element. The correct syntax for this element is XHTML syntax, which makes the element into valid XML by placing a slash character before the closing angle bracket.
This is correct:
<br/>
This is not correct:
<br>
The following example inserts a line break into the <caption> for an <item>:
<item field="EAST" formatNumber='###,###,###,###,###,###,###'>
  <caption multiline="true">
    <inline>
      EAST
    </inline>
    <br/>
    <inline>
      WEST
    </inline>
  </caption>
</item>
<container>
The <container> element provides a container for other content. The <container> can have a background image assigned to it; this image is displayed as a tiled background for the contents of the <container>. You can provide multiple <container> elements on a page, and you can nest <container> elements.
<container> elements are useful if you want to create a report that looks like a pre-printed form, with text layered over images that represents fields on the form. You can also use a <container> to provide a watermark such as “CONFIDENTIAL” or “DRAFT” for the entire report page.
The following example outputs a <list> that contains one line for each person found in the imagetest group. Each output line contains the value of the Name of each person. In this example, the <container> creates a background for the <list> output by tiling the barchartblue.png image behind the list in the report.
<report xmlns="http://www.intersystems.com/zen/report/display"
        name="imagetest">
  <body>
    <container backgroundImage="barchartblue.png" >
      <list group="person">
        <item field="Name"/>
      </list>
    </container>
  </body>
</report>
By default, Zen tiles the background image across the width and height of the container area, starting at the top left corner and tiling from left to right and top to bottom as permitted by the relative sizes of the image and the container area. You can change the image repeat and positioning style for XHTML and PDF output by applying the “Report Display Attributes” style, htmlstyle and xslfostyle to the <container>, as in the following example. Note this example also shows a convention of using nested containers on the same report page.
In this example, line breaks have been added within attribute values to avoid truncating the code on the documentation page; these line breaks would not be present in working code.
<group name="SalesRep" pagebreak="true">
  <container
  backgroundImage="ssmocreport.png"
  style="width:9.47in;height:7.76in;background-repeat:no-repeat;
         margin-top:0cm;margin-bottom:0cm;margin-left:0cm;
         margin-right:0cm;padding-top:0cm;padding-bottom:0cm;
         padding-left:0cm;padding-right:0cm;
         background-position:top left;" >
    <container
    style="font-size:.5in;margin-top:0cm;margin-bottom:0cm;
           margin-left:0cm;margin-right:0cm;padding-top:0cm;
           padding-bottom:0cm;padding-left:0cm;padding-right:0cm;"
    htmlstyle="top:5.2in;left:4in;position:relative"
    xslfostyle="top:4.8in;left:3in;absolute-position:absolute">
        <p field="@name">
            Hi there!
        </p>
    </container>
  </container>
</group>
To produce correct PDF output, the elements that you place within a <container> must be blocks of some kind. The more complex elements such as <p> <list> and <table> are blocks, but this is not the case for simpler elements like <item>. For this reason, if you wish to output a single <item> within a <container>, you must provide a block to contain it. The simple way is to insert a <div> between the <container> and the <item>. For example:
<report xmlns="http://www.intersystems.com/zen/report/display"
        name="imagetest">
  <body>
    <container backgroundImage="barchartblue.png" >
      <div>
        <item field="grandTotal"/>
      </div>
    </container>
  </body>
</report>
<container> supports the following attributes:
| Attribute | Description |
|---|---|
| Conditional expressions for display | For descriptions of the attributes that allow you to conditionally display the <img> element, see the section “Conditional Expressions for Displaying Elements.” |
| Display attributes | For descriptions of style, width, class, and other attributes, see the “Report Display Attributes” section at the beginning of this chapter. |
| backgroundImage |
URI of the source file for the background image. This URI is relative to the subdirectory in which CSP stores the supporting files for applications in the current namespace. Suppose the namespace in which the Zen report resides is called myNameSpace. Then there is a subdirectory called /csp/mynamespace below the Caché installation directory in which the image is expected to reside. If you specify: <img src="images/myPic.png" /> The Zen report class looks for the file myPic.png in the subdirectory /csp/mynamespace/images below the Caché installation directory. If the backgroundImage attribute value begins with an exclamation point, it is interpreted as an XPath expression just as in the field attribute of the <item> element. This allows you to dynamically generate URIs within the XML data, and then use these customized URIs as the image source. When using ! (exclamation point) to dynamically generate the image URI, the resulting string must be an absolute URI or it does not appear in the PDF report. Note that the built-in FOP may have problems rendering image files in .jpg format. To avoid problems, use files in .png format. |
| caption |
(Optional) Caption text for this container. Although you can enter ordinary text for this attribute, it has the underlying data type %ZEN.Datatype.captionOpens in a new tab. See “Zen Reports Attribute Data Types.” |
| height | HTML length value that specifies the area in which to display the container in the report. By default, the container contents fill this area. |
| id | Optional identifier. If present, it can be used to retrieve this element in server-side code, by calling the %GetComponentById(id) method. |
| width | HTML length value that specifies the container width. By default, the container contents fill this area. |
| writing-mode |
Adds the writing-mode attribute to the <fo:page-sequence> element in the generated XSL-FO. writing-modecontrols aspects of page layout relevant to the direction in which text is written. See the section “Writing Mode” for a detailed discussion of thewriting-mode attribute. Possible values are:
Note that not all XSL-FO renderers support all possible values. |
<div>
The <div> element can be used to group multiple elements into a block in the report output. This is useful if you want to apply a style to an entire block, such as placing a border around it. The output becomes a <div> in XHTML and a <block> in XSL-FO. For the list of elements that a Zen report <div> element can contain, see the beginning of this chapter, “Displaying Zen Report Data.”
The following example defines border styles so that a table is contained in a black bordered box. <div> can be used within tables to define bordered areas containing tables within tables.
<div style="border-style:solid;border-width:4px" >
  <p style="text-align:center;text-decoration:underline">
    "Current Address Data"
  </p>
  <table orient="row" class="subtable">
    <item field="@patient_add_street_1" class="subtable" defaultWidth="none" >
      <caption value="Street(1):" class="subtable" defaultWidth="none"/>
    </item>
    <item field="@patient_add_street_2" class="subtable" defaultWidth="none">
      <caption value="Street(2):" class="subtable" defaultWidth="none"/>
    </item>
  </table>
</div>
<div> has the following attributes.
| Attribute | Description |
|---|---|
| Conditional expressions for display | For descriptions of the attributes that allow you to conditionally display the <div> element, see the section “Conditional Expressions for Displaying Elements.” |
| Display attributes | For descriptions of style, width, class, and other attributes, see the “Report Display Attributes” section at the beginning of this chapter. |
| id | Optional identifier. If present, it can be used to retrieve this element in server-side code, by calling the %GetComponentById(id) method. |
| linefeed-treatment |
Supports the XSL-FO property linefeed-treatment. See the discussion following this table for more details. Possible values are:
See the discussion following this table for more details. |
You can use the linefeed-treatment value “preserve” to retain linefeed characters in the source data when generating PDF output. Given the following element in the Report Definition:
<element
 name='Finding'
 expression=
 '"AAA"_$C(13,10)_" "_$C(13,10)_"BBB"_$C(13,10)_" "_$C(13,10)_" "_$C(13,10)_"CCC"_$C(13,10)'
 />
The following example uses linefeed-treatment in the Report Display to output the item and retain the linefeeds:
<item
 field="Finding" width="2.65in"
 linefeed-treatment="preserve">
  <caption value="Finding"/>
</item>
You cannot use breakOnLineFeed="true" in conjunction with linefeed-treatment="preserve".
<group>
Within an XData ReportDisplay block, the <group> element allows the Zen report class to respond to the hierarchically structured data that is typical of XML.
<group> has the following attributes in XData ReportDisplay.
| Attribute | Description |
|---|---|
| Conditional expressions for display | For descriptions of the attributes that allow you to conditionally display the <group> element, see the section “Conditional Expressions for Displaying Elements.” |
| Display attributes | For descriptions of style, width, class, and other attributes, see the “Report Display Attributes” section at the beginning of this chapter. |
| breakCheck |
An XPath expression that provides a condition used to determine whether to add a page break to the report. |
| caption |
(Optional) Caption text for this group. Although you can enter ordinary text for this attribute, it has the underlying data type %ZEN.Datatype.captionOpens in a new tab. See “Zen Reports Attribute Data Types.” |
| id | Optional identifier. If present, it can be used to retrieve this element in server-side code, by calling the %GetComponentById(id) method. |
| line |
HTML length value that specifies the thickness of the line to be drawn between each iteration of the group. If line is 0, no line is drawn. "2in", "5cm", "12px", "14pt", "3em", or "75%" are all valid formats for HTML length values. A percentage is relative to the container for the element that uses the width attribute. |
| name |
Required. XPath expression that identifies the group, within the XML data source, that supplies the data for this part of the display. The elements within the <group> container determine how the display handles this data. <group> can contain the same elements as <body>. See the list of elements at the beginning of this chapter, “Displaying Zen Report Data.” <group> elements can be nested. Suppose your XML data contains <SalesRep> elements. Your XData ReportDisplay block could contain: <group name="SalesRep">...</group> Now suppose each <SalesRep> elements contains multiple <sale> elements. To specify how to display each sale within the display for each sales representative, you would provide something like: <group name="SalesRep"> <group name="sales"> ... </group> ... </group> To display a group as a table, see the group attribute of <table>. |
| pagebreak |
If true, put a page break after each iteration of the group. This attribute has the underlying data type %ZEN.Datatype.booleanOpens in a new tab. See “Zen Reports Attribute Data Types.” |
| pagebreakBefore |
If true, put a page break before each iteration of the group. This attribute has the underlying data type %ZEN.Datatype.booleanOpens in a new tab. See “Zen Reports Attribute Data Types.” |
| primaryGroup |
If true, identifies the group that is processing the primary group set by the primaryGroup attribute of <report>. This attribute has the underlying data type %ZEN.Datatype.booleanOpens in a new tab. See “Zen Reports Attribute Data Types.” |
| removeEmpty |
In the XData ReportDisplay block, the removeEmpty attribute controls whether or not empty elements and attributes that Zen encounters in the XML data for this report display in the XHTML or PDF output generated by this <group> in the report. If removeEmpty is:
This attribute has the underlying data type %ZEN.Datatype.booleanOpens in a new tab. See “Zen Reports Attribute Data Types.” |
| separator |
Use to separate rendered items. May have one of the following values:
|
| small-multiple |
Use to output the contents of the group as small multiples:
|
| small-multiple-name |
The name of the small multiple. Use with small-multiple. |
| testEachifxpath |
An XPath that provides a condition that is applied to each element of the group to determine whether the element is included in the report. Used when you are not using a primaryGroup. |
<header> and <footer>
The <header> and <footer> elements are simple containers. Their primary purpose is to help organize the propagation of styles within the report. Each of the <header> and <footer> elements can propagate its class attribute value to its children.
<header> and <footer> each support the attributes listed in the following table.
| Attribute | Description |
|---|---|
| Conditional expressions for display | For descriptions of the attributes that allow you to conditionally display the <header> or <footer> elements, see the section “Conditional Expressions for Displaying Elements.” |
| Display attributes | For descriptions of style, width, class, and other attributes, see the “Report Display Attributes” section at the beginning of this chapter. |
| foStyle |
Allows an XSL-FO style to be defined for PDF generation. The following entry in the Zen report XData ReportDisplay block: <header foStyle="font-family='Arial' font-size='14pt'"> Produces the following output in the generated XSL-FO stylesheet for the report: <fo:block font-family="Arial" font-size="14pt"> This attribute does not apply to output in XHTML format. |
| id | Optional identifier. If present, it can be used to retrieve this element in server-side code, by calling the %GetComponentById(id) method. |
<img>
The <img> element inserts an image into the report. <img> has the following attributes.
| Attribute | Description |
|---|---|
| Conditional expressions for display | For descriptions of the attributes that allow you to conditionally display the <img> element, see the section “Conditional Expressions for Displaying Elements.” |
| Display attributes | For descriptions of style, width, class, and other attributes, see the “Report Display Attributes” section at the beginning of this chapter. |
| caption |
(Optional) Caption text for this image. Although you can enter ordinary text for this attribute, it has the underlying data type %ZEN.Datatype.captionOpens in a new tab. See “Zen Reports Attribute Data Types.” |
| contentHeight |
HTML length value that specifies the actual height of the image. For PDF output, the contentHeight may be different from the height specified for the area in which to display the image in the report. "2in", "5cm", "12px", "14pt", "3em", or "75%" are all valid formats for HTML length values. A percentage is relative to the container for the element that uses the width attribute. |
| contentType |
For PDF output, contentType is required to specify the MIME content type to use for an image that is being provided as a stream from the database. For example: <img src="!test" contentType="content-type:image/jpg"/> There is more information about providing images as streams following this table. |
| contentWidth | HTML length value that specifies the actual width of the image. For PDF output, the contentWidth may be different from the width specified for the area in which to display the image. |
| height | HTML length value that specifies the area in which to display the image in the report. By default, the image contents fill this area. |
| id | Optional identifier. If present, it can be used to retrieve this element in server-side code, by calling the %GetComponentById(id) method. |
| src |
URI of the source file for the image. This URI is relative to the subdirectory in which CSP stores the supporting files for applications in the current namespace. Suppose the namespace in which the Zen report resides is called myNameSpace. Then there is a subdirectory called /csp/mynamespace below the Caché installation directory in which the image is expected to reside. If you specify: <img src="images/myPic.png" /> The Zen report class looks for the file myPic.png in the subdirectory /csp/mynamespace/images below the Caché installation directory. If the src attribute value begins with an exclamation point, it is interpreted as an XPath expression just as in the field attribute of the <item> element. This allows you to dynamically generate URIs within the XML data, and then use these customized URIs as the image source. When using ! (exclamation point) to dynamically generate the image URI, the resulting string must be an absolute URI or it does not appear in the PDF report. |
| width | HTML length value that specifies the image width. By default, the image contents fill this area. |
The following example shows how you might retrieve a stream stored in the database to use as an image in a Zen report. In XData ReportDefinition, provide an <element> or <attribute> that references the stream in the data for the report. In this reference, the expression must provide the cookie and share parameters. In reality this expression value would be all on one line, but for typesetting purposes the example breaks it into several lines:
XData ReportDefinition
[ XMLNamespace = "http://www.intersystems.com/zen/report/definition" ]
{
<report xmlns="http://www.intersystems.com/zen/report/definition"
name="streamtest" sql="select * from mine.myStream">
<group name="group">
<element name="test" field="ID"
expression='"http://localhost:57777/csp/samples/%25CSP.StreamServer.cls?
STREAMOID="_..Encrypt(##class(mine.myStream).%OpenId(%val).myStream.%Oid())_"
&CSPCHD="_%session.CSPSessionCookie_"&CSPSHARE=1"'
/>
</group>
</report>
}
To continue the example, the following XData ReportDisplay references the image stream data provided by the previous XData ReportDisplay. A contentType value is required if you are creating PDF output from this report:
XData ReportDisplay
      [ XMLNamespace = "http://www.intersystems.com/zen/report/display" ]
{
<report xmlns="http://www.intersystems.com/zen/report/display"
              name="streamtest">
  <body>
    <group name="group">
      <img src="!test" contentType="content-type:image/jpg" />
    </group>
  </body>
</report>
}
<inline>
The <inline> element is useful if you need a single line to display text of various styles. The following is an example. Note the use of <br/> to force a line break at the end of the inline content:
<inline>This is a test of </inline>
 <inline style="font-size:14pt">14 point text</inline>
 <br/>
You cannot arbitrarily nest an <inline> element inside another element. There are display elements that can have children, and display elements that can only contain text. <inline> can appear as a child of <pageheader> <pagefooter>, <pagestartsidebar>, <pageendsidebar>, <body>, <block>, <group>, or <bidioverride> only. <inline> cannot appear as a child of content elements such as <link>, <inline>, <p>, or <write>.
<inline> has the following attributes. Of these, the style attribute is the most significant for <inline>.
| Attribute | Description |
|---|---|
| Conditional expressions for display | For descriptions of the attributes that allow you to conditionally display the <item> element, see the section “Conditional Expressions for Displaying Elements.” |
| Conditional expressions for values | For descriptions of the expression and if attributes that allow you to conditionally display the value of the <item> element, see the section “Conditional Expressions for Displaying Values. ” |
| bidi-override-direction |
Sets the bi-directional override direction for the inline text. Possible values are: "rtl” and “ltr". The default is “ltr". Also supported by <p>. For more information on bi-directional text, see <bidioverride> |
| Display attributes |
Use the style attribute to apply style to the content that appears within the <inline> element. For example: For descriptions of style, width, class, and other attributes, see the “Report Display Attributes” section at the beginning of this chapter. |
| id | Optional identifier. You can use the id to access the <inline> element to change its contents programmatically. For details, see the discussion of the content property following this table. |
| linefeed-treatment |
Supports the XSL-FO property linefeed-treatment. See the discussion at the end of the section <div> for more details. |
The <inline> element is an XML projection of the Zen reports class %ZEN.Report.Display.inlineOpens in a new tab. If you view the description of this class in the online Class Reference Information, you see that it has a property called content. This is where Zen stores the text that you place in between the <inline> and </inline> elements in XData ReportDisplay. If you have a reason to programmatically change the text of an <inline> element on the server side before displaying a report, call the class method %GetComponentById(id) to retrieve a pointer to the %ZEN.Report.Display.inlineOpens in a new tab object. Then you can access the content property of this object to change it as needed.
If you manipulate the content property programmatically, keep in mind that this text string actually has the underlying data type %ZEN.Datatype.captionOpens in a new tab. See “Zen Reports Attribute Data Types.”
<inlinecontainer>
The <inlinecontainer> element adds an <fo:inline-container> element to the generated XSL-FO. It can contain an attribute that overrides the writing-mode currently in effect. It must contain <fo:block> elements even though it represents an <inline> element. The appendix “Generated XSL-FO and HTML” lists which Zen reports elements generate block and inline XSL-FO output.
Here is an example:
<inlinecontainer writing-mode="lr">
 <div><p>123</p></div> </inlinecontainer>
The <inlinecontainer> element has the following attributes:
| Attribute | Description |
|---|---|
| Conditional expressions for display | For descriptions of the attributes that allow you to conditionally display the <item> element, see the section “Conditional Expressions for Displaying Elements.” |
| Conditional expressions for values | For descriptions of the expression and if attributes that allow you to conditionally display the value of the <item> element, see the section “Conditional Expressions for Displaying Values. ” |
| Display attributes |
Use the style attribute to apply style to the content that appears within the <inline> element. For example: <inline style="font-size:14pt">14 Point Text</inline> For descriptions of style, width, class, and other attributes, see the “Report Display Attributes” section at the beginning of this chapter. |
| id | Optional identifier. You can use the id to access the <inline> element to change its contents programmatically. For details, see the discussion of the content property following this table. |
| writing-mode |
Adds the writing-mode attribute to the <fo:page-sequence> element in the generated XSL. writing-modecontrols aspects of page layout relevant to the direction in which text is written. See the section “Writing Mode” for a detailed discussion of thewriting-mode attribute. Possible values are:
Note that not all XSL-FO renderers support all possible values. |
<item>
The <item> element outputs literal values or data from the XML into the report. InterSystems recommends that you specify exactly one of the attributes field, special, or value in an <item>, because <item> outputs only one. For details on the interaction of these attributes, and their interaction with the expression attribute, see the section “Conditional Expressions for Displaying Values. ”
<item> has the following attributes:
| Attribute | Description |
|---|---|
| Conditional expressions for display | For descriptions of the attributes that allow you to conditionally display the <item> element, see the section “Conditional Expressions for Displaying Elements.” |
| Conditional expressions for values | For descriptions of the expression and if attributes that allow you to conditionally display the value of the <item> element, see the section “Conditional Expressions for Displaying Values.” |
| Display attributes | For descriptions of style, width, class, and other attributes, see the “Report Display Attributes” section at the beginning of this chapter. |
| Attributes for cross tab tables | For descriptions of the attributes used to create this specialized type of table, see Creating Type 2 Cross Tab Tables. |
| appendToZenLastPage | In order to calculate a total page count, Zen reports generates a last-page marker. A report that has multiple, independently numbered sections, effectively has more than one ‘last’ page. When you use the attribute special to include page numbers, you need to use this attribute to provide a value that generates a unique last-page marker for the section that contains the item. Use it in conjunction with the <body> attribute appendIdToZenLastPage. The value must match the value of id supplied for appendIdToZenLastPage.
See the section Page Numbering in Multi-section Reports for more information on using the appendToZenLastPage attribute. |
| breakOnLineFeed | If breakOnLineFeed is true, any line feeds that Zen encounters in element data are rendered as visible line breaks in PDF output. Line feeds are not preserved or supported within attribute values, only within the text contents of XML elements.
If breakOnLineFeed is false, line feeds are treated as white space and ignored, as is typical for XML processing. The default breakOnLineFeed value is false. Also see literalSpaces. This attribute has the underlying data type %ZEN.Datatype.booleanOpens in a new tab. See “Zen Reports Attribute Data Types.” |
| call | The name of an <xsl:template> to execute. The template must be defined in an XData block called AllXslt, HtmlXslt, or XslFoXslt in the same Zen report class. See paramNames and params in this table, and the section “Calling XSLT Templates While Rendering Items.” |
| caption | (Optional) Caption text for this item. See displayCaption. Although you can enter ordinary text for this attribute, it has the underlying data type %ZEN.Datatype.captionOpens in a new tab. See “Zen Reports Attribute Data Types.” |
| copyxml | If true, the field value of this <item> is interpreted as an XPath to be input to an <xsl:copy-of> operation; if false, the field value is interpreted as an XPath to be input to an <xsl:value-of> operation.
This attribute has the underlying data type %ZEN.Datatype.booleanOpens in a new tab. See “Zen Reports Attribute Data Types.” |
| displayCaption | If true, prefix the caption text to the item output. For additional details see <caption>.
This attribute has the underlying data type %ZEN.Datatype.booleanOpens in a new tab. See “Zen Reports Attribute Data Types.” |
| field |
If the field attribute is specified, the <item> renders the value of that field in the XML data. See the section field for more information. |
| fieldname | When a table uses sql or a queryClass and queryName to gather data, an item in the table can use the fieldname attribute to specify a data field in thesql attribute or query by name. See the sections “Creating Tables from Class Queries” and “Creating Tables with SQL”. |
| fieldnum | When a table uses sql or a queryClass and queryName to gather data, an item in the table can use the fieldnum attribute to specify a data field in thesql attribute or query by number. Also used to identify fields in the data returned to a table by a callback method. See the section “Creating Tables with a Callback Method.”. |
| formatNumber | String specifying the number format to use. This string uses the same conventions as the XSLT format-number function, such as ###.# for a three-digit number with one decimal place. When you obtain the value for the <item> using call, you cannot use the formatNumber attribute to format the result. Instead, use the XSLT format-number function inside the <xsl:template> that you are referencing with the call attribute. For more information, see the section “Calling XSLT Templates While Rendering Items.” |
| id | Optional identifier. If present, it can be used to retrieve this element in server-side code, by calling the %GetComponentById(id) method. |
| insert-zero-width-spaces |
To permit text wrapping for the contents of an <item>, set this attribute to true, as shown in the following example: <item field="@BedCode" width=".25in" insert-zero-width-spaces="true"/> When insert-zero-width-spaces is true, Zen places an invisible, zero-length space after every other character in the contents of an <item>, except for the last character. This allows the FOP and XEP rendering engines to find these spaces and use them to wrap the data inside the display column. Without this setting, the default behavior is to allow the text to run over to the next column (FOP) or condense the characters in the data to fit the space (XEP). Either default can result in illegible text. This attribute has the underlying data type %ZEN.Datatype.booleanOpens in a new tab. See “Zen Reports Attribute Data Types.” |
| linefeed-treatment | Supports the XSL-FO property linefeed-treatment. See the section <div> for more details. |
| link |
Optional hyperlink to place around the item’s data. If the link attribute begins with an exclamation point, it is interpreted as an XPath expression just as in the field attribute. This allows you to dynamically generate URIs within the XML data, and then use these customized URIs in the display. The following is an example of valid link syntax: <item value="click to open" link='!concat("MyApp.EmpDetails.cls?ID=",@id)'/> Note that you cannot enclose string arguments to concat and other XPath functions, in single quotes. You need to use double quotes or the " entity. If link is specified, the item’s style class uses the "a" option. |
| literalSpaces | If true, this attribute causes literal spaces to display as spaces rather than being skipped. To do the same for line feed characters, set breakOnLineFeed to true.
This attribute has the underlying data type %ZEN.Datatype.booleanOpens in a new tab. See “Zen Reports Attribute Data Types.” |
| paramNames | Semicolon-separated list of names of <xsl:param> arguments for an <xsl:template> to invoke for this <item>. For details, see call and params in this table, and the section “Calling XSLT Templates While Rendering Items.” |
| params | Semicolon-separated list of expressions that provide values for the <xsl:param> arguments defined for an <xsl:template> to invoke for this <item>. These expressions can be literal values, node sets, XPath expressions, or XSLT function calls. Anything that is valid as a value for <xsl:with-param> in XSLT is valid in params. For details, see call and paramNames in this table, and the section “Calling XSLT Templates While Rendering Items.” |
| special |
If the special attribute is specified, the <item> renders a predefined piece of dynamic data. For more information see the section special. |
| suppressDuplicates |
Controls whether to display duplicate values that appear in sequence in a table. For more information see the section suppressDuplicates. |
| suppressEmpty | suppressEmpty offers an alternative to removeEmpty. removeEmpty is an attribute that you can apply to a <table>, <group>, or <report>. When true, removeEmpty actually removes empty items from the output. This can misalign the data set. Depending on the application, this can have fatal or disastrous effects.
Where this poses a problem, you can use the suppressEmpty attribute on individual <item> elements. suppressEmpty displays a blank placeholder in place of any empty <item> so that positioning is not disturbed. suppressEmpty applies only to the individual <item> on which it appears. This attribute has the underlying data type %ZEN.Datatype.booleanOpens in a new tab. See “Zen Reports Attribute Data Types.” |
| value | If the value attribute is specified, the <item> renders it as a literal value. Although you can enter ordinary text for this attribute, it has the underlying data type %ZEN.Datatype.captionOpens in a new tab. See “Zen Reports Attribute Data Types.”For details on the interaction of the value attribute with field and special, and their interaction with the expression attribute, see the section “Conditional Expressions for Displaying Values.” |
The following attributes are used when generating Excel spreadsheet output in displayxlsx mode.
| Attribute | Description |
|---|---|
| excelFormula | Specifies that this aggregate should be an Excel formula in the generated spreadsheet. The value must be the name of the Excel formula equivalent to the type of the aggregate. This attribute is used only when generating an Excel spreadsheet in displayxlsx mode.
See <element> for information on how excelFormula is used in the ReportDefinition. |
| excelName | Provides the column name for Excel output. This attribute is used only when generating an Excel spreadsheet in displayxlsx mode. See <element> for information on how excelName is used in the ReportDefinition.
The excelName attribute supports localization. See Localizing Zen Reports. |
| excelNumberFormat | Provides a string that tells Excel how to format the number. This attribute is used only when generating an Excel spreadsheet in displayxlsx mode.
See <element> for information on how excelNumberFormat is used in the ReportDefinition. |
| isExcelAggregate | Indicates that this item generates an Excel aggregate. The AGGREGATETAG parameter must be set in the report for the aggregate to appear in the Excel output. This attribute is used only when generating an Excel spreadsheet in displayxlsx mode.
This attribute has the underlying data type %ZEN.Datatype.booleanOpens in a new tab. See “Zen Reports Attribute Data Types.” |
| isExcelNumber |
By default, the value supplied by an <item> is interpreted as text in the generated Excel spreadsheet. If you set the attribute isExcelNumber="true", the value is interpreted as a number in Excel. If Excel cannot interpret the value as a number, you see an error when Excel tries to open the generated spreadsheet. This attribute is used only when generating an Excel spreadsheet in displayxlsx mode. See <element> for information on how isExcelNumber is used in the ReportDefinition. |
| xmlname | Provides a name for the tag generated from this item in intermediate XML. The default tagname is <item>. Having custom tag names can be helpful in debugging. This attribute is used only when generating an Excel spreadsheet in displayxlsx mode. See “Preserving Intermediate Files for Later Viewing.” |
field
The field attribute is used as an XPath expression, so if you have the data:
<SalesRep id="1"><customer>MegaPlex Systems</customer></SalesRep>
To get the value of the id attribute you need the XPath expression:
field= "@id"
Whereas to obtain the value of the <customer> element you need the XPath expression:
field="customer"
The field attribute is interpreted with respect to the current <group> matched. For an <item> within <group name="SalesRep">, only <SalesRep> attributes and children of <SalesRep> are available.
For details on the interaction of the field attribute with special and value, and their interaction with the expression attribute, see the section “Conditional Expressions for Displaying Values. ”
special
The attribute special has the following possible values:
-
number — gives the record number within the group.
-
page-number — inserts the page number within a PDF report. Is rendered as '##' in XHTML.
-
page-count — inserts the number of pages within a PDF report. It is rendered as '##' in XHTML.
-
page-number-of — inserts the page number in the form '2 of 18'. It is rendered as '## of ##' in XHTML.
-
page-number-/ — inserts the page number in the form '2/18'. It is rendered as '##/##' in XHTML.
The last three values of special allow you to generate the last page marker id dynamically based on an XPath value defined in the field attribute of the <item>. You need to generate the last page marker dymanically when you have set the <body> attribute genLastPageIdOn.
-
page-count-with-xpath — inserts the number of pages within a PDF report. It is rendered as '##' in XHTML.
-
page-number-of-with-xpath — inserts the page number in the form '2 of 18'. It is rendered as '## of ##' in XHTML.
-
page-number-/-with-xpath — inserts the page number in the form '2/18'. It is rendered as '##/##' in XHTML.
See the section Page Numbering in Multi-section Reports for more information on using the special attribute.
ofString
The attribute ofString specifies the string used between numbers in the page numbering format '2 of 18'. The default value is “ of ”.
suppressDuplicates
If suppressDuplicates is omitted or set to 0, duplicate <item> values that appear in sequence in a <table> are displayed, as follows:
Name      Sales
John Doe  $100
John Doe  $150
John Doe  $345
If set to 1, duplicate <item> values within a <table> are not displayed:
Name      Sales
John Doe  $100
          $150
          $345
The code to produce the previous output looks something like this:
<table group="SalesPerson" width="6in"
       class="table4" altcolor="#DFDFFF">
  <item caption="Name" field="Name"
        suppressDuplicates="1" />
  <item caption="Amount" field="Amount" />
</table>
This attribute has the underlying data type %ZEN.Datatype.booleanOpens in a new tab. See “Zen Reports Attribute Data Types.”
Page Numbering in Multi-section Reports
In order to calculate a total page count, Zen reports generates a last-page marker. In a report with multiple independently-numbered sections, each section has a last page, so for the purposes of page numbering, there are multiple last pages in the report. When the report <body> element has appendIdToZenLastPage set to true, the report appends the <body> element’s id value to the last page marker for the section in order to generate a unique last-page marker. When you use the <item> attribute special to add page numbers and page counts, you use appendToZenLastPage to identify the last page marker for the section that contains the item. Therefore, the value supplied in appendToZenLastPage must match the id value of the <body> element of the section.
For details on the interaction of the special attribute with field and value, and their interaction with the expression attribute, see the section “Conditional Expressions for Displaying Values. ”
<line>
The <line> element inserts a line break between elements in the report. This can either be a visible horizontal line or an empty line break. <line> has the following attributes.
| Attribute | Description |
|---|---|
| Conditional expressions for display | For descriptions of the attributes that allow you to conditionally display the <line> element, see the section “Conditional Expressions for Displaying Elements.” |
| Display attributes | For descriptions of style, width, class, and other attributes, see the “Report Display Attributes” section at the beginning of this chapter. |
| align | Alignment within the report page. Possible values are "left", "right", and "center". |
| caption |
(Optional) Caption text for this line. Although you can enter ordinary text for this attribute, it has the underlying data type %ZEN.Datatype.captionOpens in a new tab. See “Zen Reports Attribute Data Types.” |
| color | CSS color value that specifies the line color. color only applies to solid or dashed lines |
| count | The number of line breaks to draw. This is the same as repeating the <line> element. |
| id | Optional identifier. If present, it can be used to retrieve this element in server-side code, by calling the %GetComponentById(id) method. |
| length |
HTML length value that specifies the line length. length only applies to solid or dashed lines. "2in", "5cm", "12px", "14pt", "3em", or "75%" are all valid formats for HTML length values. A percentage is relative to the container for the element that uses the width attribute. |
| lineHeight |
HTML length value that specifies how much vertical space to reserve for displaying the line. This is not the same as the line thickness when the pattern is "solid" or "dashed". lineHeight applies to "empty" lines as well. Despite using this attribute, line spacing can vary between XHTML and XSL-FO (that is, PDF). This can be overcome using <fo> and <html> elements. |
| pattern | Possible values are "empty", "solid", and "dashed". |
| thickness | HTML length value that specifies the line thickness. The default value is 1px. thickness only applies to solid or dashed lines. |
<link>
The <link> element allows a user to click on a link to display the online resource identified by the <link> destination value. To provide a link caption, enter text between the <link> and </link> elements in the report.
An important use of the <link> element is to allow one XHTML report to link to another. This can be used to create the effect of a subreport. For example:
<link
destination='concat("http://localhost:57779/csp/app/Rpt.EpHist.cls?FACILITY=",
@FACILITY,"&amp;PATID=",@PATID)'>
Episode History
</link>In the previous example, a report on a patient provides a <link> with the label “Episode History.” Clicking on this link invokes the Rpt.EpHist.cls report. The example demonstrates two important features:
-
Use of the XSLT function concat() to compose the URI from text snippets and data values.
-
Passing XPath expressions as the values for ZENURL parameters FACILITY and PATID in the target report class.
Note that you cannot enclose string arguments to concat and other XPath functions, in single quotes. You need to use double quotes or the " entity. Also note the somewhat unusual-looking string &amp;, which is required pass an ampersand character through to the URI in the browser. The first ampersand entity, &, is converted to an ampersand during Zen reports XData block processing. That ampersand and the following amp; combine to form an ampersand entity in the generated HTML which is then rendered as & by the browser.
<link> has the following attributes.
| Attribute | Description |
|---|---|
| Conditional expressions for display | For descriptions of the attributes that allow you to conditionally output the <link> element, see the section “Conditional Expressions for Displaying Elements.” |
| Display attributes | For descriptions of style, width, class, and other attributes, see the “Report Display Attributes” section at the beginning of this chapter. |
| destination | An XPath expression that provides the URI for the link destination. |
| id | Optional identifier. You can use the id to access the <link> element to change its contents programmatically. For details, see the discussion of the content property following this table. |
| internal |
If true, the link destination is the id of an element on the current page. In HTML output an internal value of true prepends the link with a # character; in XSL-FO output it assigns the internal-destination attribute to the link. If the internal attribute is false, blank, or not supplied, the link destination is assumed to be the URI of another page. This attribute has the underlying data type %ZEN.Datatype.booleanOpens in a new tab. See “Zen Reports Attribute Data Types.” |
| name | Provides a name attribute value for the link, to be used in HTML output only. |
The <link> element is an XML projection of the Zen report class %ZEN.Report.Display.linkOpens in a new tab. If you view the description of this class in the online Class Reference Information, you see that it has a property called content. This is where Zen stores the text that you place in between the <link> and </link> elements in XData ReportDisplay. If you have a reason to programmatically change the text of a <link> element on the server side before displaying a report, call the class method %GetComponentById(id) to retrieve a pointer to the %ZEN.Report.Display.linkOpens in a new tab object. Then you can access the content property of this object to change it as needed.
If you manipulate the content property programmatically, keep in mind that this text string actually has the underlying data type %ZEN.Datatype.captionOpens in a new tab. See “Zen Reports Attribute Data Types.”
<list>
The <list> element is used to display an itemized or ordered list within a Zen report. The following example outputs one line for each person found in the imagetest group. In this case, each output line contains the value of the Name of each person:
<report xmlns="http://www.intersystems.com/zen/report/display"
        name="imagetest">
  <body>
    <list group="person">
      <item field="Name"/>
    </list>
  </body>
</report>
<list> has the following attributes.
| Attribute | Description |
|---|---|
| Conditional expressions for display | For descriptions of the attributes that allow you to conditionally display the <list> element, see the section “Conditional Expressions for Displaying Elements.” |
| Display attributes | For descriptions of style, width, class, and other attributes, see the “Report Display Attributes” section at the beginning of this chapter. For a <list> element, the style attribute applies to its bullets or numbers. |
| group |
Required. If no group is specified for a <list>, there is only one item in the list. Since you want multiple items in a list, it makes sense to specify a group attribute for each <list>. Within the list you must provide one or more elements such as an <item> to identify which data from the group needs to be displayed in the list. At first glance, it appears that the rule is that the group value for a <list> in XData ReportDisplay must match the name value for a high-level <group> or <report> defined in XData ReportDefinition. Many times this is superficially true. However, this convention is more interesting than it seems. The value of the group attribute is a partial XPath expression that continues the implicit XPath expression that began with the containing <report> or <group> for the <list>. That is, group and field expressions concatenate downwards from other group and field expressions that are specified above them in the hierarchy of the <report>. Knowing this allows you to use groups and lists in more interesting ways. For detailed information about how to use XPath expressions in Zen reports, see the section “Groups, Fields, and XPath Expressions.” |
| id | Optional identifier. If present, it can be used to retrieve this element in server-side code, by calling the %GetComponentById(id) method. |
| image | The URI of an image to use as a custom bullet. If you provide an image value, the type attribute is ignored. |
| separator |
Use to separate list items. May have one of the following values:
|
| startvalue | The first number value for ordered lists. startvalue is always specified as an integer. If type is "A" and startvalue is "3", the first element in the list is labeled "C". |
| type | The bullet or numbering style to use for list items. Possible values are: "none", "circle", "square", "disc", "1", "A", "a", "I", "i". PDF reports do not support "square" or "circle". |
<p>
The <p> element renders a block of text. It uses the "p" option for its style class. <p> has the following attributes.
| Attribute | Description |
|---|---|
| Conditional expressions for display | For descriptions of the attributes that allow you to conditionally display the <p> element, see the section “Conditional Expressions for Displaying Elements.” |
| Conditional expressions for values | For descriptions of the expression and if attributes that allow you to conditionally display the value of the <item> element, see the section “Conditional Expressions for Displaying Values. ” |
| Display attributes | For descriptions of style, width, class, and other attributes, see the “Report Display Attributes” section at the beginning of this chapter. |
| bidi-override-direction |
Sets the bi-directional override direction for text in the paragraph. Possible values are: "rtl”and “ltr". The default is “ltr". Also supported by <inline>. For more information on bi-directional text, see <bidioverride> |
| caption |
(Optional) Caption text for this block. Although you can enter ordinary text for this attribute, it has the underlying data type %ZEN.Datatype.captionOpens in a new tab. See “Zen Reports Attribute Data Types.” |
| id | Optional identifier. You can use the id to access the <p> element to change its contents programmatically. For details, see the discussion of the content property following this table. |
The <p> element is an XML projection of the Zen reports class %ZEN.Report.Display.pOpens in a new tab. If you view the description of this class in the online Class Reference Information, you see that it has a property called content. This is where Zen stores the text that you place in between the <p> and </p> elements in XData ReportDisplay. If you have a reason to programmatically change the text of a paragraph on the server side before displaying a report, call the class method %GetComponentById(id) to retrieve a pointer to the %ZEN.Report.Display.pOpens in a new tab object. Then you can access the content property of this object to change it as needed.
If you manipulate the content property programmatically, keep in mind that this text string actually has the underlying data type %ZEN.Datatype.captionOpens in a new tab. See “Zen Reports Attribute Data Types.”
<pagebreak>
The <pagebreak> element inserts a page break in PDF output. It inserts a dashed line in the XHTML report on screen, and causes a page break when you print the XHTML report.
The <pagebreak> element supports the attributes listed in the following table.
| Attribute | Description |
|---|---|
| Conditional expressions for display | For descriptions of the attributes that allow you to conditionally display the <pagebreak> element, see the section “Conditional Expressions for Displaying Elements.” |
| Display attributes | For descriptions of style, width, class, and other attributes, see the “Report Display Attributes” section at the beginning of this chapter. |
| id | Optional identifier. If present, it can be used to retrieve this element in server-side code, by calling the %GetComponentById(id) method. |
<small-multiple>
The <small-multiple> element lets you output data from a <group> in a series of graphics repeated on the page. Small multiples are useful for tasks such as generating mailing labels. Zen reports takes data from a <group>, formats it in the <small-multiple> element, and then populates a <table> with the repeated elements.
To define a small multiple, first define a <group> that contains the data that fills each of the <small-multiple> elements.
<group name="Person" small-multiple="true" small-multiple-name="person-labels">
 <table orient="row" >
  <item field="@Name"/>
  <item field="@Street"/>
  <item field="@City"/>
  <item field="@State"/>
 </table>
</group>
The attribute small-multiple specifies whether the data in this group is output as small multiples. The default value is "false". The attribute small-multiple-name specifies the name of the small multiple associated with this group. The default value is "small-multiple". Note that each small multiple in a report must have a unique name.
Then you define the small multiple:
<small-multiple
 num-rows="1"
 num-cols="3"
 table-class="table4"
 table-width="5in"
 col-width="2.5in"
 name="person-labels"
/>
The name attribute has the same value as the small-multiple-name in the <group> that gathers data for this small multiple.
The <small-multiple> element supports the attributes listed in the following table.
| Attribute | Description |
|---|---|
| Conditional expressions for display | For descriptions of the attributes that allow you to conditionally display the <small-multiple> element, see the section “Conditional Expressions for Displaying Elements.” |
| Display attributes | For descriptions of style, width, class, and other attributes, see the “Report Display Attributes” section at the beginning of this chapter. |
| id | Optional identifier. If present, it can be used to retrieve this element in server-side code, by calling the %GetComponentById(id) method. |
| num-rows |
The number of rows in the table that holds the small multiple. |
| num-cols |
The number of columns in the table that holds the small multiple. |
| table-class |
The table CSS class or attribute-set. |
| table-style |
The table CSS style. |
| table-width |
The table width. |
| row-class |
The row CSS class or attribute-set. |
| row-style |
The row CSS class or attribute-set. |
| row-width |
The row width. |
| col-class |
The column CSS class or attribute set. |
| col-style |
The column CSS style. |
| col-width |
The column width. |
| name |
The name of the small multiple. The default is “small-multiple”. Each small multiple in a report must have a unique name. |
| fill-order |
Used to define how the small multiple is filled by the temporary tree defined by the group which is a collection of zr:small-multiple XML elements. horizontal means that as elements are encountered, they fill a small multiple across rows before moving down columns. vertical means the first column on the small multiple should be filled before moving on to the next. The default is horizontal. |
Because small multiple generation uses temporary trees, you must set the parameter XSLTVERSION = 2.0 for both HTML and PDF output, to ensure processing with XSLT version 2.0. You must not use the class parameter XSLTMODE or the URI parameter $XSLT to direct XSLT processing to the browser. By default, XSLT processing takes place on the server. The data in the group is stored in a variable whose name is small-multiple-name.
The following Zen reports class:
Class ZENSmallMultiple.JKSMailingLabel Extends %ZEN.Report.reportPage
{
Parameter DEFAULTMODE = "pdf";
Parameter XSLTVERSION = 2.0;
/// This XML defines the logical contents of this report.
// NEW STUFF
XData ReportDefinition [ XMLNamespace = "http://www.intersystems.com/zen/report/definition" ]
 {
  <report xmlns="http://www.intersystems.com/zen/report/definition"
   name="MailingLabel"
   sql="SELECT top 9 name,Home_Street,Home_City,
      Home_State,Home_Zip from Sample.Person order by name">
    <group name="Person">
     <element field="name" name="name"/>
     <element field="Home_Street" name="Home_Street"/>
     <element field="Home_City" name="Home_City"/>
     <element field="Home_State" name="Home_State"/>
     <element field="Home_Zip" name="Home_Zip"/>
    </group>
  </report>
 }
 /// This XML defines the display for this report.
 /// This is used to generate the XSLT stylesheets for both HTML and XSL-FO.
 XData ReportDisplay [ XMLNamespace = "http://www.intersystems.com/zen/report/display" ]
 {
  <report xmlns="http://www.intersystems.com/zen/report/display"
         name="MailingLabel">
  <document width="8.5in" height="11in"
    marginLeft=".175in" marginRight=".175in" marginTop=".5in" marginBottom=".5in" />
  <body>
   <group name="Person" small-multiple="true" small-multiple-name="person-labels">
    <table orient="row" >
     <item field="name"/>
     <item field="Home_Street"/>
     <item field="concat(Home_City,", ",Home_State," ",Home_Zip)"/>
    </table>
   </group>
   <small-multiple
    num-rows="3"
    num-cols="3"
    table-class="table4"
    table-width="8in"
    table-style="border:0pt;padding:0pt"
    row-style="border:0pt;padding:0pt;height:0.75in"
    col-width="2in"
    row-width="4in"
    name="person-labels"
   />
   </body>
  </report>
  }
}
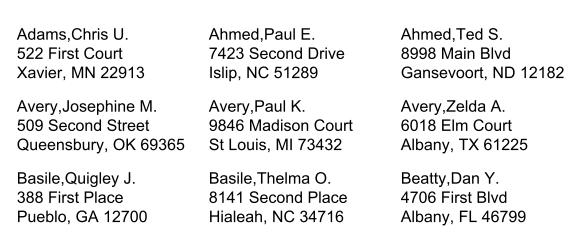
Produces the following output:
<table>
The <table> element outputs a table into the report. <table> has the following attributes.
In Zen report tables, using percentage values to specify proportional column widths works only for PDF output. Percentages do not work as width specifications for tables in Zen report XHTML output.
| Attribute | Description |
|---|---|
| Conditional expressions for display | For descriptions of the attributes that allow you to conditionally display the <table> element, see the section “Conditional Expressions for Displaying Elements.” |
| Display attributes |
For descriptions of style, width, class, and other attributes, see the “Report Display Attributes” section at the beginning of this chapter. Every cell the table renders uses td for its style class, except for header cells, which use th. |
| align |
Possible align values are "left," "right," and "center". For HTML output, the align attribute aligns the table within the report. For PDF output, a value of "center" centers text within the table, but it does not center the table with respect to the margins of the report. To center the table you must put the <table> in a <div> and position the <div>. For additional details, see the section “Centering a <table> for PDF Output.” |
| altcolor |
CSS color value that specifies the background color of the alternate rows (2, 4, 6, etc.). This is only possible when orient is "col" and group is specified. Overrides the color set report-wide with TABLEALTCOLOR. |
| caption |
(Optional) Caption text for this table. Although you can enter ordinary text for this attribute, it has the underlying data type %ZEN.Datatype.captionOpens in a new tab. See “Zen Reports Attribute Data Types.” |
| crosstab | Specifies that the table is a cross tab table. See “Creating Type 1 Cross Tab Tables.” |
| data-type, table | The data-type attribute specifies the data-type for the data in the sort column specified by orderby. Possible values are: “text”, “number”, and “qname”. |
| defaultWidth | HTML length value for the default width of the table, or the value "none" which means no column width value are generated. |
| excelGroupName | Provides a name for the tag generated from this table in intermediate XML. The default tagname is <group>. Having custom tag names can be helpful in debugging. This attribute is used only when generating an Excel spreadsheet in displayxlsx mode. See “Preserving Intermediate Files for Later Viewing.” |
| excelSheetName |
The excelSheetName attribute lets you specify a name for the generated worksheet. By default, the worksheet uses Excel's default naming convention for sheets: "Sheet1", "Sheet2" and so on. Supply excelSheetName on <report> for a single sheet report, and on each <group> that defines a worksheet for a multi-sheet report. The excelSheetName attribute supports localization. See Localizing Zen Reports. If excelSheetName begins with a ! (exclamation point) the report interprets what follows as an ObjectScript runtime expression that is evaluated to get the sheet name. Sheet names supplied by runtime expressions are not localized. For further control over sheet name generation, you can override the method %getDisplayUniqueExcelSheetName, defined in %ZEN.Report.reportPageOpens in a new tab. |
| foHeaderStyle |
Allows an XSL-FO style to be defined for the table header, for PDF generation. The following entry in the Zen report XData ReportDisplay block: <table foHeaderStyle="font-weight='bold'"> Produces output such as the following in the generated XSL-FO stylesheet for the report: <fo:table-header font-weight="bold"> This attribute does not apply to output in XHTML format. |
| foStyle |
Allows an XSL-FO style to be defined for the table as a whole, for PDF generation. The following entry in the Zen report XData ReportDisplay block: <table foStyle="font-family='Arial' font-size='9pt'"> Produces output such as the following in the generated XSL-FO stylesheet for the report: <fo:table font-family="Arial" font-size="9pt"> This attribute does not apply to output in XHTML format. |
| group |
If no group is specified for a <table>, the table is based on a single row of data, so there is only one row or column in the table. Since you want multiple rows and columns in most tables, it makes sense to always specify a group attribute for each <table>. Within the table you must provide one or more elements such as an <item> to identify which data from the group needs to be displayed in the table. At first glance, it appears that the rule is that the group value for a <table> in XData ReportDisplay must match the name value for a high-level <group> or <report> defined in XData ReportDefinition. Many times this is superficially true. However, this convention is more interesting than it seems. The value of the group attribute is a partial XPath expression that continues the implicit XPath expression that began with the containing <report> or <group> for the <table>. That is, group and field expressions concatenate downwards from other group and field expressions that are specified above them in the hierarchy of the <report>. Knowing this allows you to use groups and tables in more interesting ways. For detailed information about how to use XPath expressions in Zen reports, see the section “Groups, Fields, and XPath Expressions.” |
| id | Optional identifier. If present, it can be used to retrieve this element in server-side code, by calling the %GetComponentById(id) method. |
| layout |
Possible layout values are "auto" "fixed" and "none". For PDF output, the XEP rendering tool supports both "auto" and "fixed" formats. FOP supports "fixed" only. "none" means to suppress output of any table layout attribute value to the generated stylesheet. When layout is "fixed", it is important that you specify a width for each column. The code produces a good result from minimal width information, but you can gain closer control as follows:
|
| oldSummary |
<summary> is an element that can appear inside a <table> to provide a footer for the table. Older Zen reports use <summary> syntax conventions that are different from newer Zen reports. The <summary> section describes each convention:
This attribute has the underlying data type %ZEN.Datatype.booleanOpens in a new tab. See “Zen Reports Attribute Data Types.” |
| ongetData | Specifies a server-side callback method that supplies data for the table. See “Creating Tables with a Callback Method.” |
| orderby |
A string that identifies which columns to use to sort the <table>. It consists of a comma-separated list of elements or attributes in the XML that provides data to the <table>. If the first character in the orderby string is a ! (exclamation point) then Zen reports interpret the remainder of the string as an ObjectScript expression that provides the string. For further details, see “The orderby Attribute in ReportDisplay” following this table. For information on using orderby in the ReportDefinition section of a report, see “The orderby Attribute in ReportDefinition” in the chapter “Gathering Zen Report Data”. |
| orient | Each element contained within the table is treated as either a row or column, depending on the value of the orient attribute. If orient is "row," each child element of table is placed in a new row. Similarly, if orient is "col" each child element is placed in a new column. Possible values are "row" and "col". The default is "col". |
| queryClass | Supplies the name of a class containing a query that supplies data to the table. See the section “Creating Tables From Class Queries” |
| queryName | Supplies the name of the query that supplies data to the table. See the section “Creating Tables From Class Queries” |
| removeEmpty |
The <table> removeEmpty attribute controls whether or not the empty nodes that Zen encounters in the XML data for this report display in the XHTML or PDF output generated by this <table> in the report. If removeEmpty is:
The group attribute must be set for removeEmpty to work. This attribute has the underlying data type %ZEN.Datatype.booleanOpens in a new tab. See “Zen Reports Attribute Data Types.” |
| rowAcrossPages |
The <table> rowAcrossPages attribute controls whether table rows with multiple lines of content can be split over a page break. The default value “true” allows the row to be broken, and the value “false” forces the row to the next page if it would otherwise be split by the page break. This attribute has the underlying data type %ZEN.Datatype.booleanOpens in a new tab. See “Zen Reports Attribute Data Types.” |
| selectmode |
Used with the sql attribute. Specifies the %SELECTMODE of the SQL query that supplies data to the table. Possible values are:
For additional information see the section “Creating an Object Instance” in the book Using Caché SQL. |
| sql |
Provides an SQL statement that supplies data to the table. See “Creating Tables with SQL.” |
| writing-mode |
Adds the writing-mode attribute to the <fo:page-sequence> element in the generated XSL. writing-modecontrols aspects of page layout relevant to the direction in which text is written. See the section “Writing Mode” for a detailed discussion of thewriting-mode attribute. Possible values are:
Note that not all XSL-FO renderers support all possible values. |
The following sections provide more detail about Zen report tables:
The orderby Attribute in ReportDisplay
Like orderby in the ReportDefinition block, the orderby attribute provides a comma-separated list of fields that specify how to order items in the <table>. It overrides any ordering already present in the generated XML that provides data to the table. For information on using orderby in the ReportDefinition section of a report, see “The orderby Attribute in ReportDefinition” in the chapter “Gathering Zen Report Data”.
Each item in the orderby list is an XPath that specifies an attribute or element in the generated XML. You can also specify sorting in ascending or descending order. To do this, add a “\” (backslash) and the string ASC or DESC to the XPath in the orderby list. The default sort is in ascending order. The ASC or DESC string is not case-sensitive. You can also specify the data type of the field to be sorted as either number or text. The default data type for sorting is text. To do this, add an additional “\” (backslash) and the string number or text to the XPath in the orderby list.
The following example provides a literal value for orderby. In this example, the table uses the field “number” to sort items in descending order as numeric data.
<table orient="col" group="SortMe/item" orderby="number\DESC\number" >
  <item field="ID" width=".5in" caption="ID"/>
  <item field="number" caption="number"/>
</table>
If the first character in the orderby string is a ! (exclamation point) then Zen reports interprets the remainder of the string as an ObjectScript expression that provides the value. The following example references a Zen report class property SortBy to provide a value for the orderby attribute. In the ReportDisplay block, the current class for evaluating expressions is the class for the tag that contains the expression. In this example, the evaluation context for orderby is %ZEN.Report.Display.tableOpens in a new tab. For this reason, you cannot use double dot syntax to reference the report class property, as you do in the ReportDefinition block. You can use the Zen reports special variable %report to reference the report and dot syntax to reference its properties. You can also supply an expression as described in the section “Using Runtime Expressions in Zen Reports.”
/// Syntax appropriate for sorting via XSLT in ReportDisplay
Property SortBy2 As %String(ZENURL = "SortBy")
  [ InitialExpression = "number\ASC" ];

<table orient="col" group="SortMe/item" orderby="!%report.SortBy" >
  <item field="ID" width=".5in" caption="ID"/>
  <item field="number" caption="number"/>
</table>
Centering a <table> for PDF Output
The following example centers a 4–inch table on an 8.5–inch page with 1.25–inch left and right margins. The “start-indent” property of the <div> style attribute uses the <table> width (4 inches) and the available page width (6 inches) to position the table on the page. Because “start-indent” is inherited, you must set it to 0 on each <item> in the table.
<div width="4in"
       style="start-indent:((6in - 4in) div 2)">
 <table style="border:1pt solid black" width="4in" >
  <item field="NAME"
        style="start-indent:0;text-align:left"/>
 </table>
</div>
Displaying Elements in a <table>
A <table> can contain any Zen report display element, including <item>, <block>, <img>, and all types of chart. For a full list of display elements that can appear in tables, see the list at the beginning of this chapter: “Displaying Zen Report Data.”
When placed inside tables, display elements support the following attributes in addition to their regular attributes.
| Attribute | Description |
|---|---|
| foblock |
Use this to provide additional block styling information for the current item when it appears in XSL-FO output, for example: foblock="orphans='1'" The foblock attribute is ignored for XHTML output. |
| block-container-property |
For a simpler option, see truncate or too-long-text. (For PDF output only) If include-block-container is true, block-container-property provides formatting instructions for the block that contains the entry. The following instructions cause any overflow text to be truncated (hidden): block-container-property="overflow='hidden' width='.2in'" |
| colcount |
Tells an item in a cross tab table how many columns it should fill. colcount may be a literal number, or it may be calculated from the input. The colcount attribute is required on each item that you place inside a cross tab table. Other types of tables ignore it. For examples, see “Creating Type 1 Cross Tab Tables.” |
| grouppath |
Identifies the group that provides the values for this cross tab table item. The grouppath attribute is required on each item that you place inside a cross tab table with multiple columns or rows. It is not required if the cross tab table has only one column or row, and other types of tables ignore it. The purpose of the grouppath attribute is to enable a cross tab table to properly label and count its columns based on the input. For examples, see “Creating Type 1 Cross Tab Tables.” |
| include-block-container |
For a simpler option, see truncate or too-long-text. (For PDF output only) When there is a long string of data, XEP compresses the data to fit the allotted space. FOP overflows the data into the following space, such as the next table column, printing over what is meant to be in that space. To truncate FOP overflow for better appearance, you can set the <table> entry to be contained within a block and then set attributes of that block to the behavior you want. That is: include-block-container="true" A value of true means the entry is in a block and uses the format identified by block-container-property. A value of false means Zen applies no special formatting to the entry. This attribute has the underlying data type %ZEN.Datatype.booleanOpens in a new tab. See “Zen Reports Attribute Data Types.” |
| too-long-text |
(For PDF output only) If the too-long-text attribute is set to:
|
| truncate |
(For PDF output only) If truncate is true, any overflow text is truncated (hidden from view). This is the simple answer to issues with FOP rendering. It is not necessary to set any other attributes if you want simple truncation. This attribute has the underlying data type %ZEN.Datatype.booleanOpens in a new tab. See “Zen Reports Attribute Data Types.” Also see too-long-text. |
| truncation-height | (For PDF output only) Specifies a truncation height to use if truncate is true or if too-long-text is set to ”truncate". The default is the height of the column that contains the text. |
| truncation-width | (For PDF output only) Specifies a truncation width to use if truncate is true or if too-long-text is set to ”truncate". The default is the width of the column that contains the text. |
In order to add a blank element to a table, and ensure that it renders as blank in PDF format, you must use a non-breaking space character,  . For example, the following code:
<table orient="row" width="3.45in" class='table1'>
<item value="Sales by Sales Rep" width="2in">
<caption value="Title:" width="1.35in"/>
</item>
<item field="@month" caption="Month:"/>
<item field="@author" caption="Author:"/>
<item value=" "/>
<item field="@runBy" caption="Prepared By:"/>
<item field="@runTime" caption="Time:"/>
</table>Produces the following PDF output:
If your <table> style provides visible borders for table cells, you might discover that when the value of a field is empty, the border for its display cell disappears. This can create an uneven look for a table in which some cells have borders and others do not. You can fix this problem by adjusting the <table> style: Set the table’s CSS attribute border-collapse to the value collapse. One way to do this is to define a <class> element inside the <document> element for the report, then apply this style to the <table> using its class attribute. For example:
<class name="table.main">
  <att name="border-collapse" value="collapse" />
</class>
With:
<table class="main">
  <!-- Contents of table here -->
</table>
For details about class, see the “Report Display Attributes” section at the beginning of this chapter.
<caption>
To include a caption for a row or column of the table, an element within a table can contain a <caption> element. The <caption> element works just like <item>, and has the same attributes. For attribute details, see the <item> section.
To use a <caption> to provide a header for a column in a table, place a <caption> element inside the <item> element for that column. <caption> must be the child of the element for which it provides a header. The header text comes from the value inside the <caption> element. Also see <summary>.
When you have nested tables, it is possible for the inner table to have <caption> element within it, but that does not mean the <caption> is something for that table to display. It actually refers to giving the inner table a caption within the outer table.
A <caption> may contain line breaks to assist in formatting the text. The following example uses <br/> to insert a line break into the <caption> for an <item>:
<item field="EAST" formatNumber='###,###,###,###,###,###,###'>
  <caption>
    <inline>
      EAST
    </inline>
    <br/>
    <inline>
      WEST
    </inline>
  </caption>
</item>
If you specify the caption attribute for an <item>, and do not specify a <caption> element, <table> uses the caption attribute as a column or row header for the <item>. If you set the displayCaption attribute to true, the <item> also prefixes the text of the caption attribute to its output.
If you supply both a caption attribute and a <caption> element for an <item>, the table uses the <caption> element as a column or row header. If the displayCaption attribute is true, the <item> also prefixes the text of the caption attribute to its output, which lets you specify different text for the header and the prefix. If displayCaption is false, the content of the caption attribute is ignored.
If you are getting the caption text dynamically from the generated XML, note that the caption is applied in the table header area before the group context of the table is in effect. For this reason, you must provide the XPath specification with respect to the element that contains the table. For example, if the generated XML has this structure:
<City City="Albany">
  <Person Column1="Name" Column2="Age">
    <Name>Gaboriault,Frances E.</Name>
    <Age>4</Age>
  </Person>
</City>
You must use an XPath such as "Person/@Column1" in order to use the value of Column1 as caption, as illustrated in the following code sample.
<group name="City" pagebreak="true">
  <table group="Person" orient="col"
   class="table4" altcolor="#DFDFFF">
    <item field="Name">
      <caption field="Person/@Column1"/>
    </item>
    <item field="Age">
      <caption field="Person/@Column2"/>
    </item>
  </table>
</group>
<summary>
The <summary> element is similar to <caption>, except that it creates a footer for the row or column, instead of a header. The <summary> element has the same attributes as <item>. For attribute details, see the <item> section.
Older Zen reports use <summary> syntax conventions that are different from newer Zen reports. InterSystems recommends you use the newer syntax, but for backward compatibility with existing Zen reports, the default is to use the older syntax. This section provides syntax information for the <summary> element in each case, as follows:
-
For new Zen reports, or if you are having trouble with the output from an older Zen report that uses <summary>, add oldSummary="false" to your <table> definition and use the syntax described in the section “When <table> oldSummary is False.”
-
For older Zen reports, the section “When <table> oldSummary is True” describes the original syntax for <summary>. Adding oldSummary="true" to your <table> definition ensures that Zen follows these conventions, but this is not necessary since the default for oldSummary is true.
When <table> oldSummary is False
Consider the following sample <table>. This example displays a summary at the bottom of each column in the table. Notice that all five <summary> elements for this table appear inside the last <item> element in the <table> definition. Zen looks for <summary> elements inside <item> elements in the <table> from top to bottom. As it finds them, it assigns the contents of those <summary> elements as footer text for the output table columns, from left to right. The first <summary> goes in the first column, the second <summary> in the second column, and so on. That is the reason for the blank value attributes in the first several <summary> elements in the example: These footers apply color formatting, but contain no text. Only the last <summary> produces text, by using the field attribute to reference a value in the XML data produced by XData ReportDefinition.
These rules apply regardless of which <item> contains the <summary> elements. Since <summary> elements provide footers, it can make sense to group them all inside the last <item> in the <table>, as shown here:
<table orient="col" group="record" width="6in" class="table4"
 altcolor="#DFDFFF" oldSummary="false" >
 <item special="number" width=".45in" style="color: darkblue;">
  <caption value="#" />
 </item>
 <item field="@id" width=".7in"
  style="border:none;padding-right:4px">
  <caption value="Sale ID"/>
 </item>
 <item field="date" width="1.5in" style="padding-left: 4px;">
  <caption value="Date"/>
 </item>
 <item field="customer" width="2.65in">
  <caption value="Customer"/>
 </item>
 <item caption="Amount" width=".7in"
  style="text-align:right;" field="@number"
  formatNumber='###,###,##0.00;(#)'>
  <caption value="Amount"/>
  <summary
   style="font-style:italic;text-align:right;background-color:yellow"
   value=" "/>
  <summary
   style="font-style:italic;text-align:right;background-color:purple"
   value=" "/>
  <summary
   style="font-style:italic;text-align:right;background-color:orange"
   value=" "/>
  <summary
   style="font-style:italic;text-align:right;background-color:blue"
             value=" "/>
  <summary field="subtotal"
   style="font-weight:bold;text-align:right;background-color:red"
   formatNumber='###,###,##0.00;(#)'/>
  </item>
</table>
The following syntax is equally valid. You might prefer this convention because it groups the <caption> and <summary> for each <item> together:
<table orient="col" group="record" width="6in" class="table4"
 altcolor="#DFDFFF" oldSummary="false" >
 <item special="number" width=".45in" style="color: darkblue;">
  <caption value="#" />
  <summary
   style="font-style:italic;text-align:right;background-color:yellow"
   value=" "/>
 </item>
 <item field="@id" width=".7in" style="border:none;padding-right:4px">
  <caption value="Sale ID"/>
  <summary
   style="font-style:italic;text-align:right;background-color:purple"
   value=" "/>
 </item>
 <item field="date" width="1.5in" style="padding-left: 4px;">
  <caption value="Date"/>
  <summary
   style="font-style:italic;text-align:right;background-color:orange"
   value=" "/>
 </item>
 <item field="customer" width="2.65in">
  <caption value="Customer"/>
  <summary
   style="font-style:italic;text-align:right;background-color:blue"
   value=" "/>
 </item>
 <item caption="Amount" width=".7in"
  style="text-align:right;" field="@number"
  formatNumber='###,###,##0.00;(#)'>
  <caption value="Amount"/>
  <summary field="subtotal"
   style="font-weight:bold;text-align:right;background-color:red"
   formatNumber='###,###,##0.00;(#)'/>
 </item>
</table>
When <table> oldSummary is True
Consider the following sample XData ReportDisplay block. In this example the output display a summary in the Average, Max, and Count columns, but not in the Name column. Notice that all three of the required <summary> elements appear inside the <item> element that applies to the first <summary> element in order from left to right; that is, the Average:
<report xmlns="http://www.intersystems.com/zen/report/display"
        name="SummaryReport">
  <body>
  <table group="SalesByState">
    <item caption="Name" field="@state1" width="1in"/>
    <item field="average" formatNumber="######.##" width="4in">
       <summary value="AVERAGE" />
       <summary value="MAX" />
       <summary value="COUNT" />
    </item>
    <item field="max" formatNumber="#######.##" width="2in"/>
    <item field="count" width="2in"/>
</table>
</body>
</report>
Using Complex Headers for a <table>
To support complex headers that can exceed one line and span multiple rows or multiple columns, Zen reports provide the following elements, which can appear inside the <table> container. These elements produce output similar to HTML elements of the same name, but do so equally well for XHTML or PDF output formats.
If a Zen report <table> uses these elements it must not use <caption> or <summary> elements, as these definitions conflict.
-
<thead> — container for a header definition
-
<tr> — container for a row inside <thead> or <tfoot>
-
<th> — container for a cell inside <tr> inside <thead>
-
-
-
<tfoot> — container for a footer definition
-
<tr> — container for a row inside <thead> or <tfoot>
-
<td> — container for a cell inside <tr> inside <tfoot>
-
-
The <th> and <td> elements are similar, except that <th> appears in a header and <td> in a footer. Each <th> or <td> contains an <item> element that provides the text to display in the header. The following is a sample of a <table> with a header defined:
<table group="SaleRep" orient="col" width="6in" class="table4"
       altcolor="#DFDFFF" orderby="@state" >
  <thead style="color:red">
    <tr>
      <th>
        <item value="# " width=".45in"/>
      </th>
      <th>
        <item value="name" width="2.65in"/>
      </th>
      <th>
        <item value="state" width="2.65in"/>
      </th>
    </tr>
  </thead>
  <item special="number" width=".45in" style="color: darkblue;" />
  <item field="@name" width="2.65in" />
  <item field="@state" width="2.65in" />
</table>
When both header and footer are defined, the <tfoot> container must appear immediately after the <thead> container, before any <item> elements that provide the body of the <table>. The following is a more complex example showing a two-line header, plus a footer as well.
Note the use of colspan in the <td> and <th> definitions. <td> and <th> support colspan and rowspan attributes. Each attribute accepts a number as a value and causes the content of its parent <td> or <th> to span that number of columns or rows in the header or footer. Each produces output similar to the HTML attributes of the same name, but do so equally well for XHTML or PDF output formats.
<table group="SaleRep" orient="col" width="6in" class="table4"
       altcolor="#DFDFFF" orderby="@state" >
  <thead style="color:red">
    <tr style="color:blue">
      <th colspan="2">
        <item value="identity"/>
      </th>
      <th>
        <item value="loc"/>
      </th>
    </tr>
    <tr>
      <th>
        <item value="# " width=".45in"/>
      </th>
      <th>
        <item value="name" width="2.65in"/>
      </th>
      <th>
        <item value="state" width="2.65in"/>
      </th>
    </tr>
  </thead>
  <tfoot>
    <tr>
      <td colspan="3">
        <item value="the end" />
      </td>
    </tr>
  </tfoot>
  <item special="number" width=".45in" style="color: darkblue;" />
  <item field="@name" width="2.65in" />
  <item field="@state" width="2.65in" />
</table>
Embedding a <table> within a <table>
You can place a <table> within a <table> in XData ReportDisplay. These are called embedded tables. Simply use a <table> element where you might normally use something like <item> inside the table. Look for examples in the next section, “Creating Type 1 Cross Tab Tables.” You do not need to be working on a cross tab table to embed tables. You can embed tables anywhere your display layout requires it.
Zen Reports Cross Tab Tables
A cross tab table is one that displays a horizontal header and also uses the leftmost column as a vertical header. At the junction of each pair of headers, the table displays data related to both headers.
Some sources call a cross tab table a pivot table; other sources distinguish between cross tab and pivot tables by stating that, while they are similar, a cross tab table contains only aggregated data, whereas a pivot table may also contain data that is not aggregated. It is also possible to distinguish between tables that aggregate by row and those that aggregate by column. This book refers to all such tables as cross tab tables.
Zen reports implements two approaches to cross tab tables, identified as type 1 cross tab tables and type 2 cross tab tables. Type 1 tables were the first type of cross tab table implemented by Zen reports, and continue to be supported. Type 2 cross tab tables are recommended for new development, because it is easier to manage their layout, and they provide a more general solution to the problem of creating cross tab tables.
Creating Type 2 Cross Tab Tables
The more recently implemented type of Zen reports cross tab table enables you to place data values at a specific row/column intersection in a table. It also provides more robust support for headers and footers. The following attributes of the <item> element are used together to create these tables:
| Attribute | Description |
|---|---|
| crosstabDataGroup |
An XPath expression that locates data for a cross tab table in the context established by the crosstabRowGroup. |
| crosstabFooterDataField | An XPath expression that locates data to put in the cross tab table footer cells. This expression is evaluated in the context of the crosstabFooterGroup. If not specified, the table uses values from crosstabFooterGroup . |
| crosstabFooterFormatNumber |
If non-null, specifies how footer data is formatted. |
| crosstabFooterGroup | An XPath expression that provides the context for evaluating crosstabFooterDataField. If crosstabFooterDataField is not specified, crosstabFooterGroup locates data to put in the cross tab table footer cells. |
| crosstabHeaderDataField | An XPath expression that locates data to put in the cross tab table header cells. This expression is evaluated in the context of the crosstabHeaderGroup. If not specified, the table uses values from crosstabHeaderGroup. |
| crosstabHeaderGroup | An XPath expression that provides the context for evaluating crosstabHeaderDataField. If crosstabHeaderDataField is not specified, crosstabHeaderGroup locates data to put in the cross tab table header cells. |
| crosstabHeaderGroupLabels | An XPath expression that provides the context for evaluating crosstabHeaderLabelDataField. If crosstabHeaderLabelDataField is not specified, crosstabHeaderGroupLabels locates values to use as labels in the cross tab table header cells. |
| crosstabHeaderGroupTooLongText | Specifies how to handle text that is too long for the available space. Possible values are:
|
| crosstabHeaderLabelDataField | An XPath expression that locates values to use as labels in the cross tab table header cells. This expression is evaluated in the context of the crosstabHeaderGroupLabels. If not specified, the table uses values from crosstabHeaderGroupLabels. |
| crosstabHeaderMatchField |
An XPath expression that specifies data that matches values provided by the crosstabHeaderGroup |
| crosstabRowGroup |
An XPath expression that locates row data. Provides the context for evaluating the crosstabDataGroup. |
Each of these attributes provides an XPath expression which locates data in the generated XML for the report. The crosstabHeaderGroup provides values for column headers in the table. The crosstabRowGroup provides rows in the table.
The following example shows how to use these attributes to create a cross tab table. The example uses data from the Cinema application in the SAMPLES database. The following report definition in an XData ReportDefinition block:
<report xmlns="http://www.intersystems.com/zen/report/definition"
    name="MyReport" runonce="true">
  <group name="Beginning"
 sql="select ID,Title,Category->CategoryName as Category,Rating
         From Cinema.Film order by Category->CategoryName" >
    <group name='CategoryGrp' breakOnField="Category" >
      <attribute name="Category" field="Category"/>
      <group name="Film" breakOnField="ID">
        <attribute name="ID" field="ID"/>
        <attribute name="Title" field="Title" />
        <attribute name='FilmRating' field='Rating' />
      </group>
    </group>
  </group>
  <group name="ListRate"
    sql="select DISTINCT Rating From Cinema.Film order by Rating" >
    <element name='Rating' field="Rating" />
  </group>
</report>
Generates XML having the following structure:
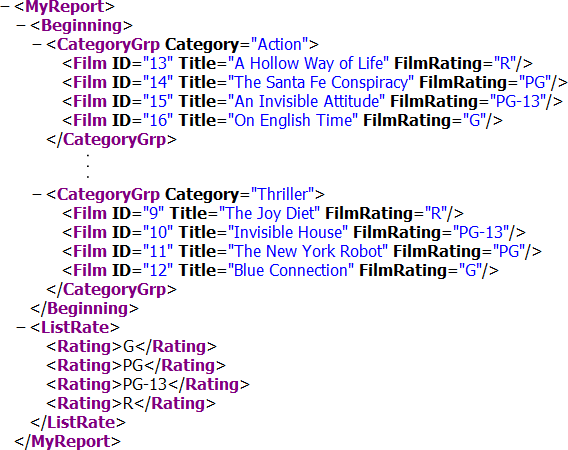
The following report definition in an XData ReportDisplay block:
<report xmlns="http://www.intersystems.com/zen/report/display"
name="MyReport">
<body>
<group name='Beginning/CategoryGrp' pagebreak="true">
<table orient='row' width="50%">
<item field='@Category'
style='text-align:center;font-weight:bold;font-size:16pt' />
</table>
<table class="table2" group="Film" orient="col" >
<item field="@Title" caption="Title" width="50%"/>
<!-- The crosstabRowGroup uses the variable "$prevmatch"
to allow the absolute XPath expression
to find the group's current iteration. -->
<item
crosstabHeaderGroup="/MyReport/ListRate/Rating"
crosstabRowGroup=
'/MyReport/Beginning/CategoryGrp[$prevmatch]/Film'
crosstabDataGroup="self::Film"
crosstabHeaderMatchField="@FilmRating"
field=""X""
style='text-align:center;font-weight:normal'
/>
</table>
</group>
</body>
</report>
Generates a report having the following structure:
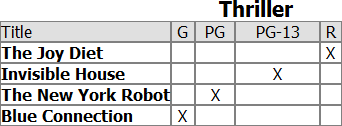
This illustration shows output for only one film category. The full report generates a similar table for each category.
The first item in the table:
<item field="@Title" caption="Title" width="50%"/>
creates the column of film titles at the left side of the table. The second item uses specialized attributes to generate column headers and put values in cells of the table.
The following illustration shows how the attributes in the cross tab <item> element reference nodes in the generated XML. Note that crosstabRowGroup and crosstabHeaderGroup require absolute location paths. The use of absolute paths means that you cannot rely on context created by an enclosing group. This report uses the special variable $prevmatch to keep track of which category the report is processing.
The variable $prevmatch contains the position of the node in the parent group which matched when the report began to fill in the table data. Additional variables are available to handle deeper levels of nesting. These variables are named $level0, $level1, $level2, and so forth, to the deepest level of nesting used in the report. The example ReportDisplay section given previously works equally well with $level1 as with $prevmatch.
The crosstabDataGroup selects the specific data node to process, and the crosstabHeaderMatchField specifies which field in the data node the report uses to determine whether the current node matches one of the columns specified by the crosstabHeaderGroup.
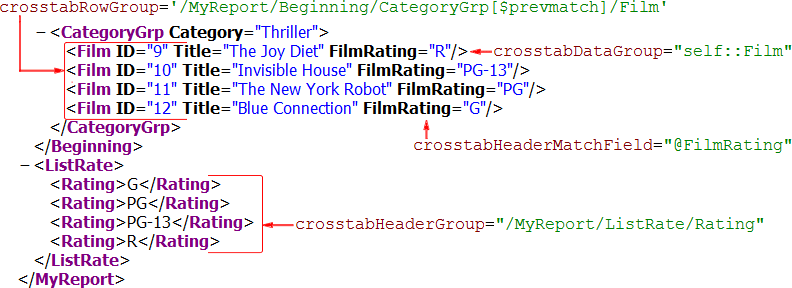
The following illustration shows how a match between a value in the crosstabHeaderGroup and the crosstabHeaderMatchField puts a value in the appropriate table cell. In this case, the value is the letter ‘X’, which is provided as the value for the field in the <item>. You could also use an XPath expression, such as @Title, that selects data from an element or attribute. Within the cross tab table, the field attribute is interpreted with respect to the crosstabDataGroup of the <item>, rather than in the context of the <table>.
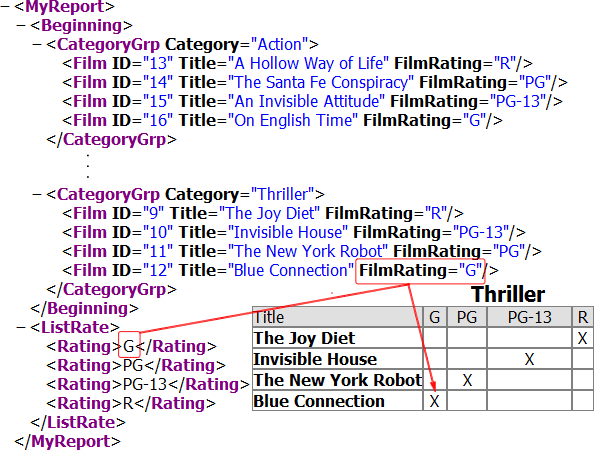
The next example shows a more complex report. The example uses data from the ZENApp application in the SAMPLES database. The following code sample shows the report definition in an XData ReportDefinition block:
<report xmlns="http://www.intersystems.com/zen/report/definition"
 name="Test" runonce="true">
 <group name="rowdata"
  sql="select salesRep, month(saleDate) as saleMonth, num
  from ZENApp_Report.Invoice order by salesRep, month(saleDate) ">
  <group name="SalesRep" breakOnField="SalesRep" >
   <attribute name="SalesRep" field="SalesRep"/>
   <group name="row" breakOnField="saleMonth">
    <attribute name="saleMonth" field="saleMonth"/>
    <element name="num" field="num"/>
    <aggregate name="month_sum" type="SUM" field="num"/>
   </group>
   <aggregate name="row_sum" type="SUM" field="num"/>
  </group>
  <aggregate name="total_sum" type="SUM" field="num"/>
 </group>
 <group name="coldata"
  sql="select month(saleDate) as saleMonth, num
  from ZENApp_Report.Invoice order by month(saleDate) ">
  <group name="col" breakOnField="saleMonth">
   <attribute name="saleMonth" field="saleMonth"/>
   <attribute name="name"
    field="saleMonth"
    expression=
    '$piece(##class(%SYS.NLS.Format).GetFormatItem("MonthName")," ",%val+1)'/>
   <aggregate name="col_sum" type="SUM" field="num"/>
  </group>
 </group>
</report>
The following code sample shows the report as defined in the XData ReportDisplay block:
<report xmlns="http://www.intersystems.com/zen/report/display"
 name="Test">
 <body>
  <table group="rowdata/SalesRep" class="table2"
   oldSummary="false" >
   <item field="@SalesRep" caption="SalesRep">
    <summary value="Total" />
   </item>
   <item crosstabHeaderGroup="/Test/coldata/col"
    crosstabHeaderDataField="@saleMonth"
    crosstabHeaderGroupLabels="/Test/coldata/col"
    crosstabHeaderLabelDataField="@name"

    crosstabRowGroup="/Test/rowdata/SalesRep"
    crosstabDataGroup="row"
    crosstabHeaderMatchField="@saleMonth"
    field='month_sum'

    crosstabFooterGroup="/Test/coldata/col/"
    crosstabFooterDataField="col_sum" >
   </item>
   <item field="row_sum" caption="Total" >
    <summary field="rowdata/total_sum" />
   </item>
  </table>
 </body>
</report>
The attribute crosstabHeaderGroupLabels is redundant in this example. If it is not specified, the report uses the value of crosstabHeaderGroup, which is the same in this case. The existence of crosstabHeaderGroupLabels lets use a different location in the XML for the header labels.
The following illustration shows the XML generated by the ReportDefinition block. It also shows which attributes of the item in the ReportDisplay refer to which data in the XML. Notice that the crosstabDataGroup and the crosstabHeaderMatchField are evaluated in terms of the crosstabRowGroup.
In this example, crosstabHeaderGroup, crosstabHeaderGroupLabels, and crosstabFooterGroup all point to the same node in the XML: "/Test/coldata/col". In a report with a different data structure, these three attributes could have different values, which provides the potential for greater flexibility in constructing cross tab tables.
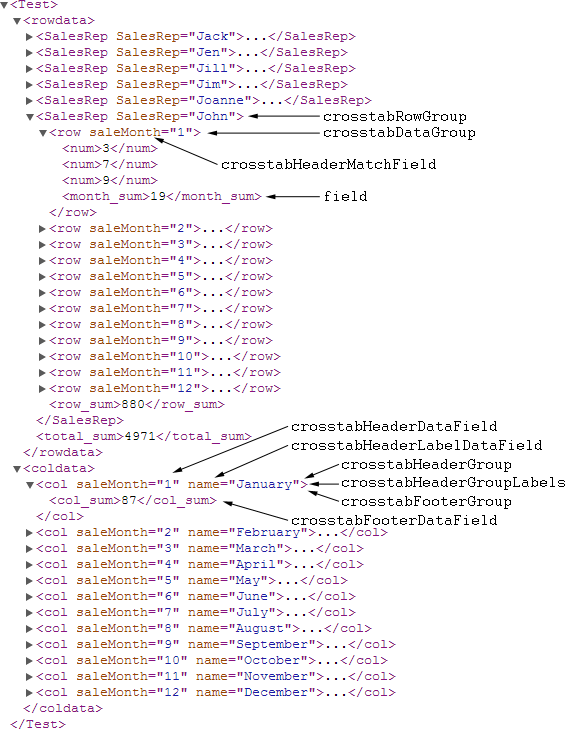
The item attributes that identify fields are evaluated in the context of another attribute that provides an absolute XPath to a node in the XML. The report builds the XPath to the field by concatenating the context attribute and the field attribute. The following list shows these relationships for the one set of attributes in this example:
-
value of crosstabHeaderGroup: "/Test/coldata/col"
-
value of crosstabHeaderDataField: "@saleMonth"
-
path to crosstabHeaderDataField: "/Test/coldata/col/@saleMonth"
The next illustration shows how the data referenced by the item attributes appears in the resulting cross tab table. The crosstabHeaderLabelDataField is used to replace the numeric sale month provided by the crosstabHeaderDataField with the name of the month. The crosstabFooterGroup provides the row of column sums that appears at the bottom of the table. The property field functions here much as it did in the previous example. It provides the values for each cell at the intersection of sales person and month, as determined by crosstabHeaderMatchField.
This illustration also shows the additional <item> and <summary> elements that supply the row headers and row totals. In both cases, the item property caption provides the header for the column, and the <summary> element provides the footer value.
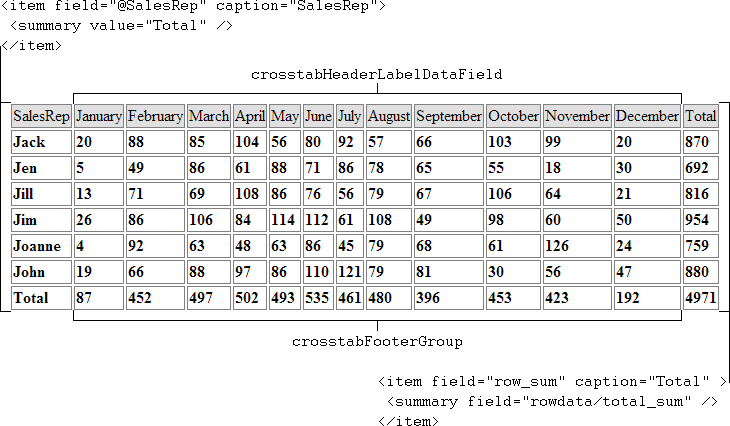
Note that $prevmatch is not always updated correctly if XSLTVERSION = 1.0, which can result in incorrect output, especially in cross tab tables that use footers. To avoid this problem, set XSLTVERSION = 2.0.
Creating Type 1 Cross Tab Tables
This section discusses the first type of cross tab table implemented by Zen reports.
Introducing Cross Tab Tables
Suppose an insurance company maintains information about the buildings it insures. Each building has the following fields in the insurance company database:
-
Policy — Identification number
-
Start — Policy start date
-
Expiry — Policy expiration date
-
Location — Are the surroundings rural or urban?
-
State — State or territory within a country
-
Region — Region of the country; includes more than one State
-
InsuredValue — What is the amount of money for which this building is insured?
-
Construction — What is the construction type: fire resistant, frame, masonry, or metal-clad?
-
BusType — What is the purpose of the structure: Hospitality, Office, Farming, Apartment, etc.
-
Flood — Is the building in a designated flood zone: yes or no?
A line item table to report on this data might look like the following example. The example shows five entries. This report does not process or aggregate values in any way; it pulls each value straight from the database.
Our portfolio might includes hundreds or thousands of such entries. It is difficult for us to efficiently assess the state of our business based on such a table. It simply contains too much data to scan. Also, depending on what we want to learn about our business, it contains many fields that do not matter to our analysis.
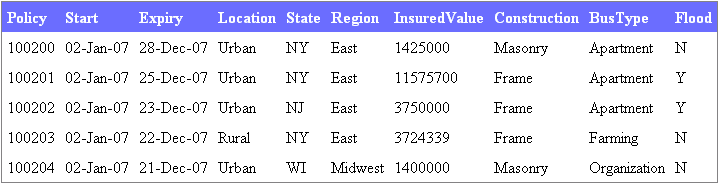
To better support an analysis based on our source data, we could aggregate selected fields from within this data to create a cross tab table like the following example. Each table cell contains the total Insured Value of all buildings in our portfolio that have a particular Construction type in a particular Location type. At right we also include a column that displays a total Insured Value for each Construction type. Suppose our research department tells us that frame buildings in urban areas are the most likely to catch fire. The aggregated data in this chart clearly indicates how value and risk are distributed across our portfolio:
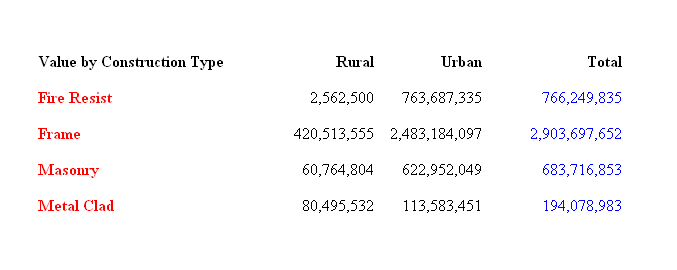
The following two code examples show how to generate the cross tab table shown in the previous figure. The first example shows the XData ReportDefinition block. This block:
-
Retrieves the three relevant fields from the database (Construction, Location, and InsuredValue).
-
Groups all values by Construction.
-
Records the Construction type (Fire Resist, Frame, Masonry, or Metal Clad).
-
Groups Construction values by Location.
-
Records the Location type (Rural or Urban).
-
Generates the values to place in the Rural and Urban columns by summing the InsuredValue for each combination of Construction type and Location type. These values are stored in an aggregate called Total in each Location group.
-
Generates the value to place in the output column called “Total” by summing the InsuredValue for each Construction type regardless of Location. This value is stored in the aggregate called TotalConstruction in each Construction group.
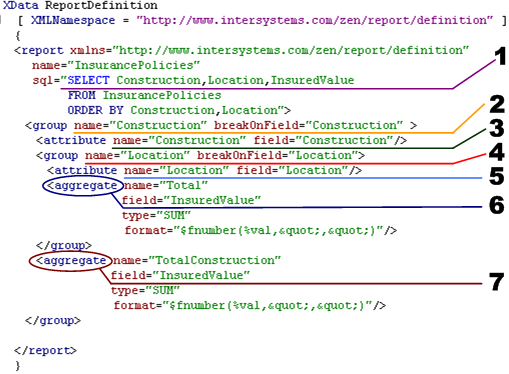
The next example shows the XData ReportDisplay block for this sample cross tab table. This block does the following:
-
Define a style to apply to each <table> within the embedded table definition. This style (table.table) is borderless so that the five embedded tables that structure the display looks like a single table in the output.
-
Define the top level <table> container with column orientation.
-
To create the first column in the top level <table>, define a <div> that contains a <table> with column orientation. This table contains one column. The entries in this column come from values of the Construction attribute in the Construction group. Values are the Construction types defined in the database (Fire Resist, Frame, Masonry, or Metal Clad). Entries have bold red style and the column width is two inches. The caption for this column is a literal string, “Value by Construction Type.”
-
To create the second column in the top level <table>, define a <div> that contains a <table> container with column orientation. This <table> contains two <table> elements, each of which defines a table with row orientation. The output from this part of the definition consists of two columns, each of which may contain some columns and rows.
-
For the first column in the <table> from step 4, define a <table> with row orientation and crosstab set to 1. The entries in this table come from values of the Total aggregate in the Location group.
This is a row oriented table, so there is a column for each Location type and a row for each Construction type. This produces two columns and four rows. There is no special style for this text. The captions for the columns in this table come from values of the Location attribute in the Location group: “Rural” and “Urban.”
As is required for cross tab tables with multiple columns or rows, the <item> and <caption> elements in this <table> each specify a grouppath and a colcount value:
-
grouppath identifies the group that provides the values for this cross tab table item. The grouppath attribute is required on each item that you place inside a cross tab table with multiple columns or rows. It is not required if the cross tab table has only one column or row. Other types of tables ignore the grouppath attribute. The purpose of grouppath is to enable a cross tab table to properly label and count its columns based on the input.
-
colcount tells an item in a cross tab table how many columns it should fill. colcount may be a literal number, or it may be calculated from the input. The colcount attribute is required on each item that you place inside a cross tab table. Other types of tables ignore colcount.
-
-
For the second column in the <table> from step 4, define a <table> with row orientation and crosstab set to 1. The entries in this table come from values of the TotalConstruction aggregate in the Construction group.
This is a row oriented table, so there is a row in the table for each Construction type. This produces one column and four rows. Entries have blue color. The caption for this column is a literal string, “Total.”
As is required for cross tab tables with multiple columns or rows, the <item> and <caption> elements in this <table> each specify a colcount value. Since there is only one column, this value is 1.
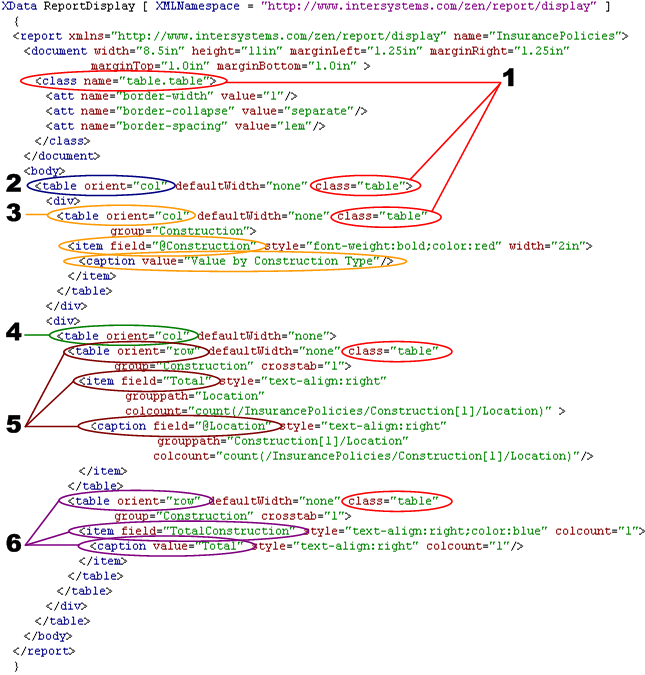
The following figure uses borders to show how the previous code example creates the visual effect of a single table, while it actually consists of five embedded tables. A solid black border surrounds each <table> in the cross tab table definition:
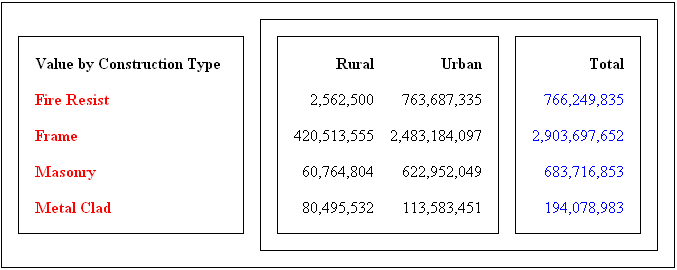
Using the Pivot Table Generator
Zen provides a pivot table generator that:
-
Accepts your specification of which fields you wish to aggregate from your data source.
-
Generates Zen report classes that contain cross tab or pivot tables based on your data.
The pivot table generator outputs Zen report classes that use the cross tab table syntax described in the previous section. By generating the syntax instead of typing it into the class directly, you can focus on the data rather than how it looks on the page. This saves time and allows you generate more complex and interesting reports that can potentially offer a deeper analysis of your data.
To invoke the pivot table generator, issue a sequence of ObjectScript commands at the Terminal command line prompt or place statements in a Caché routine or class method. The following example sequence provides COUNT and SUM aggregates on the Insured Value of a set of insurance policies:
 zn "USER"
 set Gen=##class(%ZEN.Report.pivotTableGenerator).%New()
 set Gen.reportName="InsurancePolicies"
 set Gen.table="SQLUser.InsurancePolicies"
 set Gen.group="Policy"
 set Gen.cols="Region"
 set Gen.rows="Flood,Construction,BusType"
 set Gen.value="InsuredValue"
 set agg = ##class(%ZEN.Report.aggregate).%New()
 set agg.type="COUNT"
 set agg.name="Count"
 do Gen.aggs.Insert(agg)
 set agg = ##class(%ZEN.Report.aggregate).%New()
 set agg.type="SUM"
 set agg.name="Sum"
 do Gen.aggs.Insert(agg)
 set Gen.className="PivotTables.FloodRegionBusTypeConstrGen"
 set Gen.classNameForTotals="PivotTables.FloodRegionBusTypeConstrGenTotals"
 do Gen.genZenReport()
 kill
The previous sample command sequence:
-
Changes to the namespace where it creates new classes.
-
Creates a new %ZEN.Report.pivotTableGeneratorOpens in a new tab instance and sets some basic properties. For a full list of properties see the table following this example.
-
Creates a new %ZEN.Report.aggregateOpens in a new tab object and sets some properties, including a type of COUNT. The <aggregate> section describes all the properties you can set.
-
Inserts the new COUNT aggregate into the aggs collection for the %ZEN.Report.pivotTableGeneratorOpens in a new tab instance.
-
Creates a new %ZEN.Report.aggregateOpens in a new tab object and sets some properties, including a type of SUM. The <aggregate> section describes all the properties you can set.
-
Inserts the new SUM aggregate into the aggs collection for the %ZEN.Report.pivotTableGeneratorOpens in a new tab instance.
-
Finishes defining the %ZEN.Report.pivotTableGeneratorOpens in a new tab instance by providing values for the className and classNameForTotals properties.
-
Invokes the genZenReport() method to generate and compile the new classes. These classes now exist in the namespace from step 1.
-
Invokes KILL to remove local variables created by this command session.
-
Once you have generated the class, you may edit it in Studio to fine-tune the details.
%ZEN.Report.pivotTableGeneratorOpens in a new tab has the following properties.
| Properties | Description |
|---|---|
| aggs |
Collection of %ZEN.Report.aggregateOpens in a new tab objects. Each member of this collection:
|
| className | Full package and class name of the Zen report class to generate. |
| classNameForTotals | Full package and class name of a supplementary class that provides some of the aggregated values for the report. The generated Zen report class references the supplementary class using <get>. |
| cols | In the output pivot table, columns are numbered from left to right starting at 1. The cols attribute provides a comma-separated list of strings to use as column labels in columns 2 and higher in the output table. |
| group | Field by which to group the entries in the generated XML data for the report. |
| reportName | Value to use for the <report> name attribute in the generated Zen report class identified by className. |
| rows | In the output pivot table, columns are numbered from left to right starting at 1. The rows attribute provides a comma-separated list of strings to use as row labels in column 1 of the output table. |
| table | Data source for the report. |
The following example sequence provides a CUSTOM “count distinct” aggregate on the Policy value for a set of insurance policies:
 zn "USER"
 set Gen=##class(%ZEN.Report.pivotTableGenerator).%New()
 set Gen.reportName="InsurancePolicies"
 set Gen.table="SQLUser.InsurancePolicies"
 set Gen.group="Policy"
 set Gen.cols="Region"
 set Gen.rows="Flood"
 set Gen.value="Policy"
 set agg = ##class(%ZEN.Report.aggregate).%New()
 set agg.type="CUSTOM"
 set agg.class="%ZEN.Report.Aggregate.CountDistinct"
 do Gen.aggs.Insert(agg)
 set Gen.className="PivotTables.FloodRegionGen"
 set Gen.classNameForTotals="PivotTables.FloodRegionGenTotals"
 do Gen.genZenReport()
 kill
The previous sample command sequence:
-
Changes to the namespace where it creates new classes.
-
Creates a new %ZEN.Report.pivotTableGeneratorOpens in a new tab instance and sets some basic properties. For a full list of properties see the previous table.
-
Creates a new %ZEN.Report.aggregateOpens in a new tab object and sets some properties. It identifies a type of CUSTOM and uses the class property to identify the class that computes the aggregate. The <aggregate> section describes all the properties you can set.
-
Inserts the new CUSTOM aggregate into the aggs collection for the %ZEN.Report.pivotTableGeneratorOpens in a new tab instance.
-
Finishes defining the %ZEN.Report.pivotTableGeneratorOpens in a new tab instance by providing values for the className and classNameForTotals properties.
-
Invokes the genZenReport() method to generate and compile the new classes. These classes now exist in the namespace from step 1.
-
Invokes KILL to remove local variables created by this command session.
-
Once you have generated the class, you may edit it in Studio to fine-tune the details.
The following two figures illustrate the Zen report class generated by the previous sample command sequence. All of this text appears in one Zen report class; each figure indicates any omitted or truncated text with ellipses (...). The first figure shows the top left portion of the class, highlighting the DEFAULTMODE and XSLTMODE parameters and the XData ReportDefinition block. The second figure shows the bottom left portion of the same class, featuring the XData ReportDisplay block.
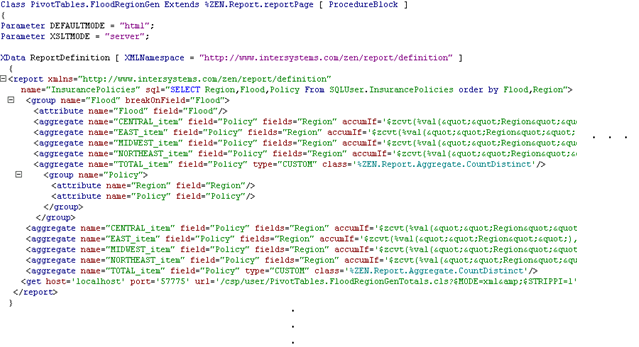
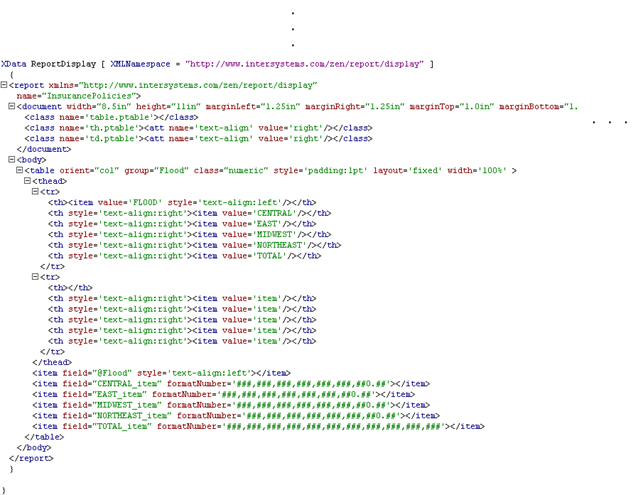
Creating Tables with a Callback Method
Another technique for supplying data to a table is to use a callback method. The attribute ongetData specifies the name of a method written in ObjectScript or another suitable language and executed on the server. It returns a two dimensional, 0-based array by reference. ongetData is similar to the ongetData attribute which specifies a callback method used by Zen reports charts to supply data. See “Providing Data for Zen Report Charts.” In addition to the array reference, a second argument is passed to the ongetData callback method. This argument is also passed by reference, and contains parameter values defined by the table. If the method signature does not include the parameters argument, you get an error. The callback method has access to the xmlfile Zen report property, which allows you to use XPATH techniques to populate the data, using the Caché built-in XPATH implementation. Callback tables are helpful if you want to display data as both a table and a chart. Items in a callback table cannot use the fieldName attribute. Instead, they must use the fieldNum attribute.
The following code example creates a simple callback table. Note that the ReportDefinition section of the report is a placeholder. Data is generated by the table callback method.
Class MyApp.LoopTableCallback Extends %ZEN.Report.reportPage
{
/// ReportDefinition is a placeholder.
XData ReportDefinition [ XMLNamespace = "http://www.intersystems.com/zen/report/definition" ]
{
  <report xmlns="http://www.intersystems.com/zen/report/definition"
    name="MyReport" runonce="true">
  </report>
}
XData ReportDisplay [ XMLNamespace = "http://www.intersystems.com/zen/report/display" ]
{
  <report xmlns="http://www.intersystems.com/zen/report/display"
   name="MyReport">
    <body>
      <table ongetData="NamesAndAddresses" >
        <parameter value="EpicFigures" />
        <item fieldnum="1" >
          <caption value="Name"/>
        </item>
        <item fieldnum="2" >
          <caption value="Address" />
        </item>
      </table>
    </body>
  </report>
}

Method NamesAndAddresses(ByRef var As %String, ByRef params)
  {
   if (params(1) = "EpicFigures")
     {
       Set var(0,0)="Santa Claus"
       Set var(0,1)="North Pole"
       Set var(1,0)="Zeus"
       Set var(1,1)="Olympus"
       Set var(2,0)="Robin Hood"
       Set var(2,1)="Sherwood Forest"
     }
    if (params(1) = "RegularGuys")
     {
       Set var(0,0)="Joe Smith"
       Set var(0,1)="Cleveland"
       Set var(1,0)="Bob Jones"
       Set var(1,1)="Boise"
       Set var(2,0)="Fred Small"
       Set var(2,1)="Deluth"
     }
  }
}
Creating Tables From Class Queries
The queryClass and queryName <table> attributes allow you to populate a table with data directly from a class query. queryClass provides the name of the class, and queryName provides the name of the query within the class, as illustrated in the following example:
<body>
  <table queryClass="Sample.Person" queryName="ByName"
    selectmode="2" orient="col">
    <item fieldnum="1">
      <caption value="ID"/>
    </item>
    <item fieldnum="2">
      <caption value="Name"/>
    </item>
  </table>
</body>
The table can also use the orderBy attribute to sort the results, which is useful when you cannot rewrite the class to provide the desired sorting. The suppressDuplicates attribute is also supported.
Creating Tables with SQL
The sql <table> attribute allows you to populate a table with data from an SQL statement. You cannot use <group> in the table if you are getting data from the sql attribute. The <item> elements in such a table use the fieldnum or the fieldname attribute to identify the data. fieldnum supplies the 1–based number of the projection field in the SQL statement. fieldname supplies the name of the field as returned by the SQL statement.
<body>
  <table
    sql="SELECT NAME,AGE,FAVORITECOLORS FROM SAMPLE.PERSON WHERE NAME %STARTSWITH ?"
    selectmode="2" orient="col" class="table4" >
    <parameter value="B"/>
    <item fieldname="NAME" suppressDuplicates="true" width="1.5in">
      <caption value="Name"/>
    </item>
    <item fieldname="AGE" width=".5in">
      <caption value="Age"/>
    </item>
    <item fieldname="FAVORITECOLORS">
      <caption value="Favorite Colors"/>
    </item>
    <table sql="SELECT AGE,NAME FROM SAMPLE.PERSON WHERE NAME=?" selectmode="2" orient="col">
      <parameter fieldname="NAME"/>
      <item fieldname="AGE">
        <caption value="Years Old"/>
      </item>
    </table>
  </table>
</body>
Creating Tables with onCreateResultSet
The onCreateResultSet <table> attributes allows you to use a callback method to populate a table with data. You cannot use <group> in the table if you are getting data from the onCreateResultSet attribute. The <item> elements in such a table use the fieldnum or the fieldname attribute to identify the data. fieldnum supplies the 1–based number of the projection field in the SQL statement. fieldname supplies the name of the field as returned by the SQL statement.
<body>
  <table onCreateResultSet="MyRS" selectmode="2" orient="col" class="table4">
    <parameter value="B"/>
    <item fieldname="NAME" suppressDuplicates="true" width="1.5in">
      <caption value="Name"/>
    </item>
    <item fieldname="AGE" width=".5in">
      <caption value="Age"/>
    </item>
    <item fieldname="FAVORITECOLORS">
      <caption value="Favorite Colors"/>
    </item>
  </table>
</body>
Method MyRS(ByRef pSC, ByRef tParams)
{
  set statement=##class(%SQL.Statement).%New()
  set sql = "SELECT Name,Age,FavoriteColors FROM Sample.Person WHERE Name %STARTSWITH ?"
  Set pSC=statement.%Prepare(sql)
  Set statement.%SelectMode=2
  Set ^foobar($i(^foobar))="pSC="_pSC
  if $$$ISERR(pSC) quit ""
  ;zw tParams
  if $D(tParams) {
    Set rs=statement.%Execute(tParams(1))
  } else {
    Set rs=statement.%Execute()
  }
  quit rs
}
<timeline>
The <timeline> element can be used to display a graphic summary of episodes. An episode is a period of time with a start date and an end date.
Some episodes are indicated as generated in the data. You can use the attributes episode-type-node-set and generated-type-code to identify generated data. You can graph generated data using a distinctive color, specified by generated-type-color. The <timeline> determines the start and end dates for the timeline from the data. You can use the attributes static-start-date and static-end-date to override the automatic calculation. Note that variables are in XPath format, so you must quote constant strings. You cannot place a <timeline> inside a <table> unless you place it in a <block>, <group>, <container>, or other “wrapper” element first.
You must set the parameter XSLTVERSION = 2.0 for both HTML and PDF output, to ensure processing with XSLT version 2.0. You must not use the class parameter XSLTMODE or the URI parameter $XSLT to direct XSLT processing to the browser. By default, XSLT processing takes place on the server.
<timeline> has the following attributes.
| Attribute | Description |
|---|---|
| background-color |
An XPath expression that provides the background color of the timeline graph. The default background-color is white. |
| current-date |
A date, indicated by a downward pointing arrow on the timeline if the date falls within the range of the date data. By default, current-date is the date the timeline graph was generated, but you can use this attribute to set an alternate date. The value of this attribute is not an XPath expression, unlike the majority of <timeline> attributes. |
| end-date-node-set |
The XPath expression for end dates. An episode consists of a start date, and end date, and an optional episode type. The node sets for these three types of data are grouped to form episodes based on position in the XML file: the first start date, end date, and episode type encountered define the first episode, and so forth. |
| episode-type-node-set |
The XPath expression for episode types. The episode type determines whether an episode is considered a generated episode. An episode consists of a start date, and end date, and an optional episode type. The node sets for these three types of data are grouped to form episodes based on position in the XML file: the first start date, end date, and episode type encountered define the first episode, and so forth. |
| generated-type-code |
An XPath expression that provides a string or integer indicating a generated episode. When Zen reports finds this value in an episode type node, the episode is considered a generated episode, and is charted using the generated-type-color. |
| generated-type-color | An XPath expression that provides the color used to draw generated episodes. Generated episodes are those that have the generated-type-code value in the episode type node. The default generated-type-color is gray. |
| interval-height | An XPath expression that provides the height of episode ticks and X axis ticks. |
| interval-type | An XPath expression that provides the type of interval you are charting on the timeline. The interval type can be “year”, “quarter”, “month” or “day”. If you do not supply an interval type, it is determined from the data.
The interval-type interacts with on-color and off-color in the following ways:
|
| max-height | The maximum height of the episode graph. If the entire data set does not fit in the available space, unseen episodes are indicated with an up-arrow. The value of this attribute is not an XPath expression, unlike the majority of <timeline> attributes. |
| minimum-interval-width | An XPath expression that specifies the width of an interval in the timeline, in millimeters (mm). An interval can be a day, a month, a quarter or a year. Constants must be quoted, "'10mm'" for instance. |
| number-of-intervals | The number if intervals in the graph. By default, this value is calculated from the data, but you can use this attribute to override that automatic calculation. The value of this attribute is not an XPath expression, unlike the majority of <timeline> attributes. |
| off-color | An XPath expression that provides the color of intervals on the X axis when they are "off". The on and off state of intervals groups them visually on the X axis. Which intervals are considered “on” and which are considered “off” is determined by the interval-type attribute. The default off-color is white. |
| on-color | An XPath expression that provides the color of intervals on the X axis when they are "on". The on and off state of intervals groups them visually on the X axis. Which intervals are considered “on” and which are considered “off” is determined by the interval-type attribute. The default on-color is gray. |
| plotting-color | An XPath expression that provides the foreground color used to graph episodes that are not generated, see generated-type-color. The default plotting-color is black. |
| start-date-node-set |
The XPath expression for start dates. An episode consists of a start date, and end date, and an optional episode type. The node sets for these three types of data are grouped to form episodes based on position in the XML file: the first start date, end date, and episode type encountered define the first episode, and so forth. |
| static-end-date | An XPath expression that overrides the automatic calculation of the end date from the data. A right arrow indicates data to right of the static end date. |
| static-start-date | An XPath expression that overrides the automatic calculation of the start date from the data. A right arrow indicates data to left of the static start date. |
Here is an example using the timeline element:
<timeline
  plotting-color="'black'" background-color="'white'"
  max-height="9" generated-type-code="'1'" generated-type-color="'gray'"
  interval-height="'5mm'" minimum-interval-width="'5mm'" width="'2000mm'"
  on-color="'gray'" off-color="'white'"
  start-date-node-set="/MyTimeLine/dates/start-date"
  end-date-node-set="/MyTimeLine/dates/end-date"
  episode-type-node-set="/MyTimeLine/dates/episode-type"
  static-start-date="'2009-07-20'" static-end-date="'2009-08-05'"/>
The preceding code produces a timeline graph given the following data set:
<MyTimeLine>
  <dates>
    <start-date>2009-07-30</start-date>
    <end-date>2009-07-31</end-date>
    <episode-type>0</episode-type>
    <start-date>2009-06-30</start-date>
    <end-date>2009-07-31</end-date>
    <episode-type>1</episode-type>
    <start-date>2009-07-30</start-date>
    <end-date>2009-07-31</end-date>
    <episode-type>0</episode-type>
    <start-date>2009-07-30</start-date>
    <end-date>2009-07-31</end-date>
    <episode-type>0</episode-type>
    <start-date>2009-07-30</start-date>
    <end-date>2009-07-31</end-date>
    <episode-type>0</episode-type>
    <start-date>2009-07-29</start-date>
    <end-date>2009-08-15</end-date>
    <episode-type>0</episode-type>
    <start-date>2009-07-02</start-date>
    <end-date>2009-08-03</end-date>
    <episode-type>0</episode-type>
  </dates>
</MyTimeLine>
Note that you have considerable flexibility in how the data elements are arranged in the file. For example, the following data set produces the same timeline graph as the preceding one:
<MyTimeLine>
  <dates>
    <start-date>2009-07-30</start-date>
    <start-date>2009-06-30</start-date>
    <start-date>2009-07-30</start-date>
    <start-date>2009-07-30</start-date>
    <start-date>2009-07-30</start-date>
    <start-date>2009-07-29</start-date>
    <start-date>2009-07-02</start-date>
    <end-date>2009-07-31</end-date>
    <end-date>2009-07-31</end-date>
    <end-date>2009-07-31</end-date>
    <end-date>2009-07-31</end-date>
    <end-date>2009-07-31</end-date>
    <end-date>2009-08-15</end-date>
    <end-date>2009-08-03</end-date>
    <episode-type>0</episode-type>
    <episode-type>1</episode-type>
    <episode-type>0</episode-type>
    <episode-type>0</episode-type>
    <episode-type>0</episode-type>
    <episode-type>0</episode-type>
    <episode-type>0</episode-type>
  </dates>
</MyTimeLine>