Introducing Zen Reports
To generate a Zen report, you start by creating a Zen report class, which performs two main functions:
-
Gather data to be presented by the report.
-
Define how the data is formatted and displayed in the report.
Many Zen reports perform these functions with two XML sections in the Zen report class, an XData ReportDefinition block and an XData ReportDisplay block. The ReportDefinition takes data, often from a Caché database, and creates an XML document. The XData ReportDisplay, creates an XSLT stylesheet which is applied to the XML provided by the ReportDefinition to transform it into an appropriate output format. The following figure shows an overview of this process:
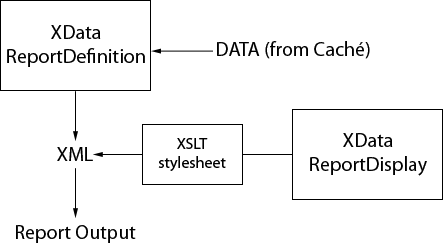
The primary goal of Zen reports is to enable you to create reports based on data in a Caché database. To increase flexibility and power, Zen reports can also incorporate data from other sources. The XML generated by the ReportDefinition must have a structure suitable for processing by the XSLT stylesheet generated by the ReportDisplay. If the ReportDefinition block does not provide XML in the correct format, you can invoke an additional step and use an XML stylesheet to perform additional transformations prior to generating the report output. The following illustration summarizes the possible data sources, and shows the optional use of an XML stylesheet.
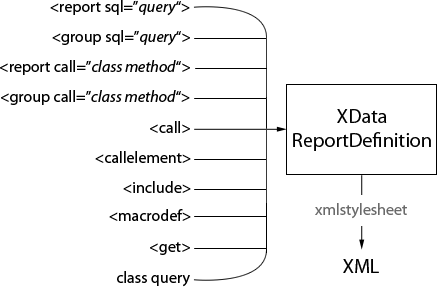
You can generate Zen reports without using a ReportDefinition block. The application parameter DATASOURCE provides an XML document that contains the data for the Zen report. The report parameter xmlstream specifies a stream object that provides the XML data source. It is discussed in the section “Zen Report Class Properties.”
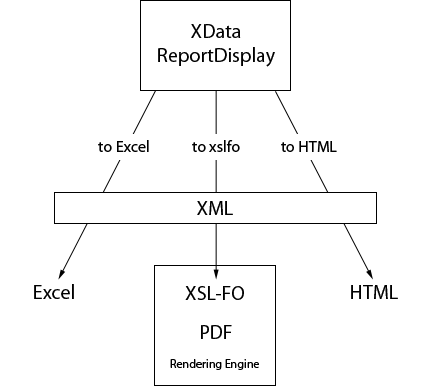
The primary output formats for Zen reports are Excel, PDF, and HTML. Output in TIFF format is also possible.
The ReportDisplay block generates a different XSLT stylesheet depending on the output format you have selected. The stylesheet is applied to the XML produced by the ReportDisplay to generate the report. Note that in the case of PDF output, the XSLT stylesheet creates an XSL-FO document which is used by the PDF rendering engine to create the final PDF output.
The XData ReportDisplay block is relevant to production of reports in Excel format only when the XML from the ReportDefinition needs to be transformed into the specific structure required for Excel output. Production of Excel spreadsheets is discussed in the section “Configuring Zen Reports for Excel Spreadsheet Output.”
The Caché installation provides a version of Apache FOP as a PDF rendering engine. You can also use the XEP PDF rendering engine from RenderX, or download and install FOP from Apache.
Background Reading
Before using Zen reports, you need a good understanding of the following topics:
-
HyperText Markup Language (HTML), eXtensible Markup Language (XML), XPath syntax, and Cascading Style Sheets (CSS). Many excellent books are available through the Internet and commercial bookstores.
-
Caché, ObjectScript, Caché Server Pages, and Caché SQL. Depending on your level of experience, you might want to review the following books from the InterSystems documentation set:
Zen Report Tutorial
A Zen report is a class that extends %ZEN.Report.reportPageOpens in a new tab, which in turn extends the base class for Caché Server Pages, %CSP.PageOpens in a new tab. This topic explores the structure of a Zen report class by building it in gradual steps.
If you have a new Caché installation, before you begin this exercise you must first run the ZENDemo home page. Loading this page silently generates data records for the SAMPLES namespace. You only need to do this once per Caché installation.
Enter the following URI in the browser:
http://localhost:57772/csp/samples/ZENDemo.Home.clsOpens in a new tab
Where 57772 is the Web server port number that you have assigned to Caché.
Now begin the exercise as follows:
-
Start Caché Studio.
-
Choose File > Change Namespace or F4.
-
Choose the SAMPLES namespace.
-
Choose File > New or Ctrl-N or the
 icon.
icon. -
Select the Zen tab.
-
Click the New Zen Report icon.
-
Click OK.
The Zen Report Wizard presents the fields shown in the following table. For this exercise, enter the values shown in the right-hand column of the table.
Field Meaning Value to Enter Package Name The package that contains the report class. MyApp Class Name The report class name. ReportDemo Application The package and class name of the application associated with this report. Associates the Zen report with a Zen application, which provides default values for built-in class parameters. Values specified in the report take priority. If unspecified, the Zen report uses %ZEN.Report.defaultApplicationOpens in a new tab. Report Name The logical name of this report within its application. MyReport Description Any text that you want to use to describe the report. Sample of building a new report. Click Next.
-
The wizard prompts you to enter an SQL query to provide data for the report. Type:
SELECT ID,Customer,Num,SalesRep,SaleDate
FROM ZENApp_Report.Invoice ORDER BY SalesRep,Customer
Click Finish.
The New Report Wizard creates and displays a Zen report page class with predefined parameter values and the XML blocks XData ReportDefinition and XData ReportDisplay.
-
Find the following text in the XData ReportDefinition block. Place the cursor between this comment and the closing </report> element and click to move the insertion point there:
<!-- add definition of the report here. --> -
A report consists of one or more nested groupings. Define the first grouping inside the XData ReportDefinition block by adding the following <group> element at the insertion point, before </report>:
<report xmlns="http://www.intersystems.com/zen/report/definition" name="MyReport" sql="SELECT ID,Customer,Num,SalesRep,SaleDate FROM ZENApp_Report.Invoice ORDER BY SalesRep,Customer" > <group name="SalesRep" breakOnField="SalesRep"> </group> </report> -
Choose Build > Compile or Ctrl-F7 or the
 icon.
icon. -
Choose View > Web Page or the
 icon. If you have difficulty viewing the Zen report page from Studio, start a browser session and enter the class name as follows:
http://localhost:57772/csp/samples/MyApp.ReportDemo.clsOpens in a new tab
Where 57772 is the Web server port number that you have assigned to Caché.
The XML view of your report data displays as follows. It has structure, but no content:
<?xml version="1.0" ?> <MyReport> <SalesRep/> <SalesRep/> <SalesRep/> <SalesRep/> <SalesRep/> <SalesRep/> </MyReport> -
Add an <attribute> element to the <group> within XData ReportDefinition:
<report xmlns="http://www.intersystems.com/zen/report/definition" name="MyReport" sql="SELECT ID,Customer,Num,SalesRep,SaleDate FROM ZENApp_Report.Invoice ORDER BY SalesRep,Customer" > <group name="SalesRep" breakOnField="SalesRep"> <attribute name="name" field="SalesRep" /> </group> </report> -
Compile the class and view the report. The XML output appears as follows. Each <SalesRep> element now includes an attribute, name, whose value is the SalesRep field returned by the SQL query:
<?xml version="1.0" ?> <MyReport> <SalesRep name="Jack"/> <SalesRep name="Jen"/> <SalesRep name="Jill"/> <SalesRep name="Jim"/> <SalesRep name="Joanne"/> <SalesRep name="John"/> </MyReport> -
Add an <aggregate> element to the group within XData ReportDefinition:
<report xmlns="http://www.intersystems.com/zen/report/definition" name="MyReport" sql="SELECT ID,Customer,Num,SalesRep,SaleDate FROM ZENApp_Report.Invoice ORDER BY SalesRep,Customer" > <group name="SalesRep" breakOnField="SalesRep"> <attribute name="name" field="SalesRep" /> <aggregate name="total" type="SUM" field="Num" /> </group> </report> -
Compile the class and view the report. The XML output appears as follows. Each <SalesRep> element now includes an element called <total>. The value within <total> is the sum of all the Num field values for the corresponding SalesRep field returned by the SQL query:
<?xml version="1.0" ?> <ReportDemo> <SalesRep name="Jack"> <total>833</total> </SalesRep> <SalesRep name="Jen"> <total>774</total> </SalesRep> <SalesRep name="Jill"> <total>983</total> </SalesRep> <SalesRep name="Jim"> <total>826</total> </SalesRep> <SalesRep name="Joanne"> <total>824</total> </SalesRep> <SalesRep name="John"> <total>825</total> </SalesRep> </ReportDemo> -
Add more <aggregate>, <element>, and <group> elements within XData ReportDefinition:
<report xmlns="http://www.intersystems.com/zen/report/definition" name="MyReport" sql="SELECT ID,Customer,Num,SalesRep,SaleDate FROM ZENApp_Report.Invoice ORDER BY SalesRep,Customer" > <group name="SalesRep" breakOnField="SalesRep"> <attribute name="name" field="SalesRep" /> <aggregate name="total" type="SUM" field="Num" /> <aggregate name="average" type="AVG" field="Num" /> <aggregate name="clients" type="COUNT" field="Customer" /> <group name="SalesTo" breakOnField="Customer" > <element name="customer" field="Customer" /> <attribute name="date" field="SaleDate" /> </group> </group> </report> -
Compile the class and view the report. The XML output now displays a much larger data set for each sales person. The aggregate elements <total>, <clients>, and <average> appear at the end of each <SalesRep> record.
-
Now that you have structured the report data as XML, you can specify how to display this data.
Find the XData ReportDisplay block, which follows the XData ReportDefinition block. This section contains the following default report definitions structure, which includes several optional elements.
<report xmlns="http://www.intersystems.com/zen/report/display"
  name="MyReport">
  <!-- Optional Init element inserts custom XSLT instructions at
       the top level of the generated XSLT stylesheet. -->
  <init ></init>
  <!-- Optional Document element specifies page layout and style characteristics. -->
  <document width="8.5in" height="11in" marginLeft="1.25in"
            marginRight="1.25in" marginTop="1.0in" marginBottom="1.0in" >
  </document>
  <!-- Optional Pageheader element. -->
  <pageheader ></pageheader>
  <!-- Optional Pagefooter element. Does not apply in HTML output. -->
  <pagefooter ></pagefooter>
  <!-- Required Body element. -->
  <body>
    <!-- add display definition of the report here. -->
  </body>
</report>
In this tutorial, you add code to the <body> element.
-
Find the following text in the <body> element of the report. Place the cursor between this comment and the closing </body> tag and click to move the insertion point there:
<!-- add display definition of the report here. --> -
At the insertion point, place a <p> that contains text for the title of the report:
<body>
 <p>Tutorial Sales Report</p>
</body>
Also add the title attribute to the <report> element to set the title of the browser window:
<report xmlns="http://www.intersystems.com/zen/report/display" name="MyReport" title="Tutorial Sales Report"> ... </report> -
Change the DEFAULTMODE class parameter value from "xml" to "html".
-
Compile the class and view the report.
-
Add a table to XData ReportDisplay as follows:
<report xmlns="http://www.intersystems.com/zen/report/display"
        name="MyReport" title="Tutorial Sales Report">
  <body>
    <p>Tutorial Sales Report</p>
    <group name="SalesRep" line="1px">
      <table orient="row" width="4in">
        <item field="@name" width="2in">
          <caption value="Sales Rep:" width="2in"/>
        </item>
        <item field="total" formatNumber="##0.00">
          <caption value="Total Value of Sales:"/>
        </item>
        <item field="clients">
          <caption value="Number of Clients:"/>
        </item>
      </table>
    </group>
  </body>
</report>
Where:
-
<group name="SalesRep"> is a reference to the <SalesRep> element in the generated XML.
-
<item field="@name"> is the syntax for referring to the <SalesRep> attribute name.
-
<item field="total"> is the syntax for referring to the <SalesRep> element <total>.
-
-
Compile the class and view the report.
-
Highlight the heading by formatting it using a predefined style class. Change the <p> element in XData ReportDisplay as follows:
<p class="banner1">Tutorial Sales Report</p>
-
Compile the class and view the report.
-
Consider adding the following display modifications within XData ReportDisplay. Some of these changes affect style and layout; others add data to the display:
<report xmlns="http://www.intersystems.com/zen/report/display" name="MyReport" title="Tutorial Sales Report"> <body> <p class="banner1">Tutorial Sales Report</p> <group name="SalesRep" line="1px"> <line pattern="empty"/> <table orient="row" width="4in"> <item field="@name" width="2in"> <caption value="Sales Rep:" width="2in"/> </item> <item field="total" formatNumber="##0.00"> <caption value="Total Value of Sales:"/> </item> <item field="average" formatNumber="##0.00"> <caption value="Average Individual Sale:"/> </item> <item field="clients"> <caption value="Number of Clients:"/> </item> </table> <line pattern="empty"/> <table orient="col" group="SalesTo" altcolor="#FFDFDF" width="3.8in"> <item field="customer" > <caption value="Customers:"/> </item> <item field="@date" > <caption value="Date of Sale:"/> </item> </table> </group> </body> </report> -
Compile the class and view the report.