Using the Studio Debugger
The Studio debugger lets you step through the execution of programs running on a Caché server. Programs that can be debugged include INT files, BAS files, MAC files, methods within CLS files, CSP classes responding to HTTP requests, server-side methods invoked from Java or ActiveX clients, or server-hosted applications. To step through, or set breakpoints within classes or CSP pages, open the corresponding INT or BAS file and use the debugging commands in it. To view INT source code files, go to the Tools > Options dialog, Compiler, General Flags tab and enable the Keep Generated Source Code option.
You can connect the debugger to a target process in one of the following ways:
-
Define a debug target (name of program, routine, or Zen or CSP page to debug) for the current project using Project > Settings > Debugging > Debug Target (or Debug > Debug Target). Then select Debug > Go to start the target program and connect to its server process.
-
Select Debug > Attach and choose a running process on a Caché server.
To attach to a running process, you must have either the %ALL role or the same $USERNAME as the process you are trying to debug.
Sometimes using command-line debugging with the zbreak command can give you better control. For more information on zbreak, see the chapter “Command-Line Routine Debugging” in Using Caché ObjectScript.
Sample Debugging Session: Debugging a Routine
The following example demonstrates how to debug a Caché routine.
-
Start Studio and select File > New Project to create a new project called Project1.
-
Create a new routine by selecting File > New > General tab > ObjectScript Routine.
-
Enter code for this routine:
MyTest ; MyTest.MAC Main() PUBLIC { Set a = 10 For i = 1:1:10 { Set b = i Write b," " } } -
Save and compile the new routine as MyTest.MAC using File > Save As.
-
Define a debug target for the project by selecting the Debug > Debug Target tab, selecting Class Method or Caché Routine, and entering the name of the entry point in your new routine, Main^MyTest.
-
Set a breakpoint in the routine: Position the cursor anywhere on the line Set a = 10 and press F9, the Toggle Breakpoint key. A breakpoint indicator appears in the left margin,
 .
. -
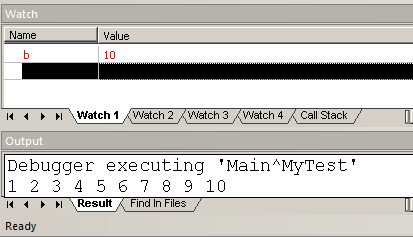
Select Debug > Go to begin debugging. When the debugger stops at your breakpoint, the next command to be executed is outlined with a yellow box. The INT file opens in a new window (if you enabled the Keep Generated Source Code option, on the Tools > Options dialog, Compiler, General Flags tab).
-
Enter b and a (as Watchpoints) in the Watch window (View > Watch) so that you can watch the values.
-
Step through execution of the program by repeatedly selecting Debug > Step Into (F11) and notice the b value change.
You can stop debugging by stepping to the end of the program or by selecting Debug > Stop.
Debugger Settings for the Current Project
Some debug settings are defined and stored in the current project. These include:
-
Debug Target
-
Breakpoints
Debug Target
A debug target tells Studio what process you want to debug.
To specify a debug target for a project, select Project > Settings > Debugging > Debug Target or select Debug > Debug Target. Choose one of the following, which is started when you select Debug > Go. You can also set a debug target by placing the cursor next to an item in a editor window, right-clicking, and selecting Set xxxx as debug target.
The routine (and tag), class, or method that you want to debug when Debug > Go is executed. For example, enter Test^MyRoutine() to begin execution at the tag Test in the routine MyRoutine. Or enter the name of a class method to execute, such as ##class(MyApp.Person).Test(1).
The Zen or CSP page to be accessed when you invoke Debug > Go. The debugger connects to the Caché server process that is servicing the CSP page's HTTP request. Use this option for debugging CSP applications, for example, to step through the code for the Test.csp page, enter /csp/user/Test.csp as a debug target.
Breakpoints
A project maintains a list of breakpoints that you set with F9. When you start debugging a project's debug target (with Debug > Go), the breakpoints defined by the project are set in the target process.
To view breakpoints, select Debug > Breakpoints > View Breakpoints. To add and remove breakpoints, place the cursor at the breakpoint location and select Debug > Breakpoints > Toggle Breakpoint or F9. You can also add or remove breakpoints using Project > Settings > Debugging > Breakpoints.
20 is the maximum number of breakpoints that can exist in a routine. If more than 20 breakpoints are set, the Debugger displays <ROUTINELOAD>^%Debugger.System.1 and halts debugging.
Debug Menu
Debug menu options are described below:
 Attach Attach |
Displays a list of processes currently running on the Caché server and lets you attach to one to debug. If you select a process and select OK, Studio breaks into the selected target process and allows you to start debugging it. If you generated source for the current routine executing in the target process, the source is displayed in an editor window. If you later terminate debugging with Debug > Stop, the target process resumes executing. |
 Go Go |
If you are not currently debugging, Go starts the target specified by the Project's debug target. (f you haven't set a target, you are asked for one. A debug target is the name of routine or method to execute; you can set this using theDebug Target dialog. Once the target is started, it runs until the first breakpoint. If you did not set any breakpoints in your application, it runs to completion without stopping. |
 Restart Restart |
Halts execution of the target process, restarts it, and resumes debugging (as if the Go command was used). |
 Stop Stop |
Stops debugging and either halts the target process or detaches from it. If the target process was running and attached to with Attach, then the target process continues running. If the target process was started as a result of the Go command, then it is terminated. |
| Break |
Pauses execution of the target process (that is, if the debugger is attached to a target process that is currently running, not stopped). |
 Interrupt Interrupt |
Interrupts execution of the current command. |
| Step Into | Executes the current command in the target process and stops on the next command, stepping into any function calls or loop bodies. |
 Step Over Step Over |
Executes the current command in the target process and stops on the next command. The debugger steps over any function calls or code blocks (such as loops) it encounters; it stops on the command following the function call or code block. |
 Step Out Step Out |
Advances the execution of the target process by leaving or stepping out of the current code block or function and stops on the next command at this outer level. |
 Run To Cursor Run To Cursor |
Available only for documents containing INT routines. Starts execution of the target process and stops when it reaches the line on which the cursor is currently located. This is equivalent to setting a breakpoint at the current line in the editor window, executing the Go command, and clearing the breakpoint when the program halts. |
| Watch | Toggles Watch window Display. |
| Breakpoints | Toggle Breakpoints  Sets or clears a breakpoint on the current line in the current document. View Breakpoints: Opens the Breakpoints dialog with which you can list, add, and remove breakpoints. Sets or clears a breakpoint on the current line in the current document. View Breakpoints: Opens the Breakpoints dialog with which you can list, add, and remove breakpoints. |
| Debug Target | Enter a debug target – a method, routine, Zen page, or CSP page. See also “Debug Target” |
Watch Window
The Watch Window displays a table in which you can watch the values of variables and simple expressions. All variables and expressions listed in the Watch Window (called watchpoints) are evaluated after each debugger operation (such as Step Over) and their resulting values are displayed in the second column of the Watch Window. If the value of a variable or expression changes after a debugger operation, it is displayed in red. If a variable in the watch list is undefined when it is evaluated then the value is displayed as: <UNDEFINED>. Similarly, any expression whose result is an error displays an error message for its value. Note that you can also see the value of a variable displayed in a hint in the debugger by hovering your mouse over the variable.
To add a variable or expression to the Watch Window, double-click an empty cell in the first column and enter the variable or expression. Alternatively you can use your mouse to highlight text in an editor window, drag it over an empty cell in the Watch Window and drop it. You can edit the contents of the Watch Window by double-clicking on a variable or expression and typing.
The following are examples of variables and expressions you could enter into the Watch Window:
-
a
-
a + 10
-
a(10,10)
-
$L(a)
-
person.Name
You can also change the value of a variable in the target process by entering a new value in the Value column of the Watch Window.