Debugging
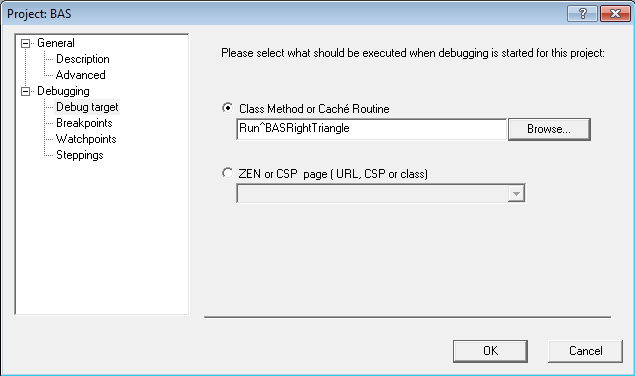
Studio provides an interactive debugger for Basic. Within a project's settings—click Project and then Settings—specify a Debugging Target, which is usually the routine you want to debug.
Use F9 to toggle one or more breakpoints in the routine. You can also set watchpoints, by clicking Project, Settings, and Watchpoints. A breakpoint is a location within a routine where execution will stop. A watchpoint is a variable that will cause execution to stop whenever its value changes. Click F5 to run the routine using the debugger. Studio will create a Terminal process, attach to it, and display it in the Output window. Your routine will run in that process, stopping when it reaches a breakpoint or a watchpoint. In Studio, use F10 (step over) and F11 (step into) to step through the code. The Watch window allows you to specify variables and displays their changing values as the code runs.