Debugging an MVBasic Routine in Studio
To debug your MVBasic routine in Studio, do the following:
-
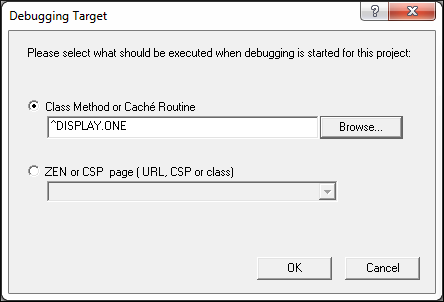
Set a Debug target: Click Debug–>Debug Target on the Studio menu bar. On the dialog, enter the name of the target. The name of the target is the name of the routine preceded by a ^. For example, if the name of your routine is DISPLAY.ONE.mvb, the name of the debugging target is ^DISPLAY.ONE.

-
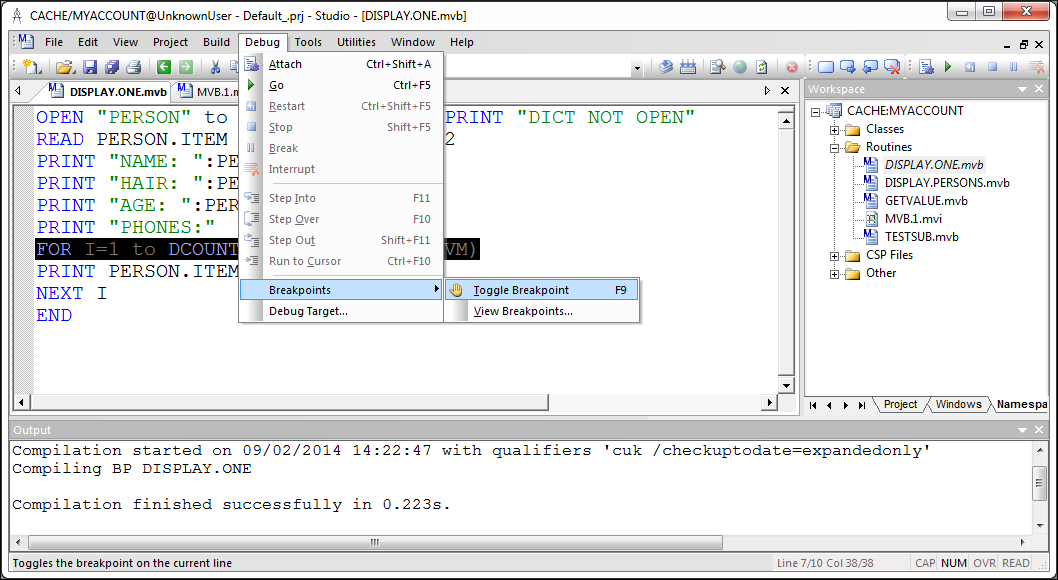
Add a breakpoint: Highlight a line of code and then click Debug–>Breakpoints–>Toggle Breakpoint on the Studio menu bar.

-
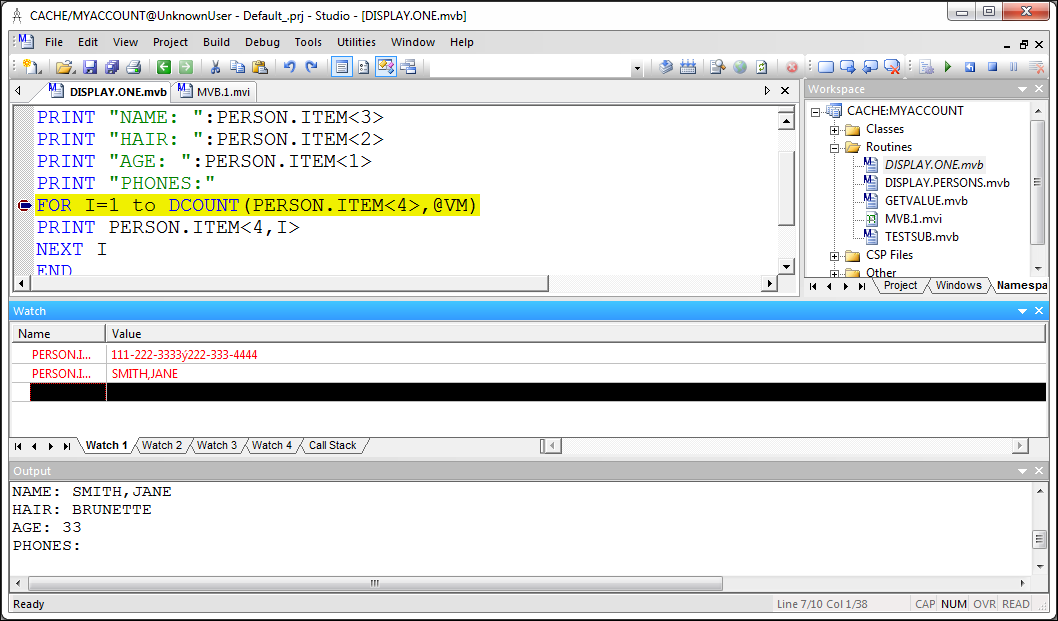
Begin debugging: Click Debug–>Go on the Studio menu bar. The debugger begins executing the routine and pauses at the breakpoint. The bottom pane shows output from the routine. You can enter in the names of watch variables in the center pane:

-
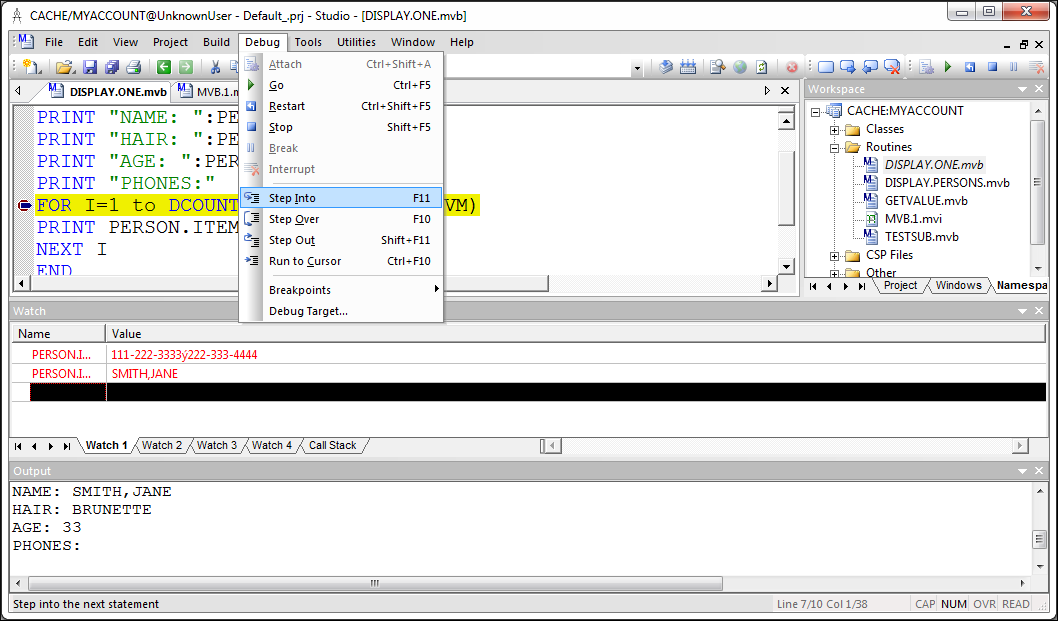
Continue debugging by choosing an action: Click Debug and then click on an action for the debugger.
