
Using the SQL Explorer (2.12)
To help you make use of the tables in the system, InterSystems Data Studio™ provides the SQL Explorer. You can use this to examine tables, as well as run custom SQL queries.
Note that the user roles govern both the tables that you have permission to see and the SQL queries you have permission to run.
Introduction
To access the SQL Explorer, click the SQL Explorer ![]() icon in the application
menu.
icon in the application
menu.
For your use cases, two areas are of primary interest:
-
The tree on the left, where the Schema Explorer displays all the schemas and tables you have permission to see.
-
The Execute Query tab on the right, which you use to execute SQL queries as described on this page.
Viewing the Contents of a Schema
To view the contents of a schema:
-
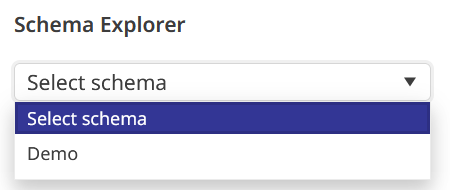
Click the Schema drop-down to expand it. The drop-down lists the schemas that you have permission to access. Click the schema you would like to view. The schema’s tables appear under the name of their data source.
For example:
-
Drag and drop a table name into the large box on the Execute Query tab.
An SQL SELECT query listing all the fields in the table appears in the box. For example:
SELECT * FROM Demo.mysample_data -
Click Run Query.
The system then executes the query. By default, the system shows data in display mode. For example, this means that a date field is shown in human-readable form and long values are truncated for readability.
You have the following additional options to refine what you see:
-
Select a different mode; the options are Display Mode (the default) and ODBC Mode.
-
Specify a different value for the Max Rows field, which limits how many rows of data to return from a query. By default, results are limited to 1,000 rows, but you can raise this limit (up to 2,000) by changing the value in the Max Rows field. (You can also limit the number of rows of data to return by using a TOP clause within the query.)
-
Edit the query, for example, by reordering or removing fields. Then click Run Query.
-
Enable rollbacks by setting Rollback on Script Error to YES (the default is NO). When enabled, all statements in the script are rolled back if any statement fails.
-
Click Get Query Plan to view the query’s cost and execution steps.
Viewing Fields in a Table
In addition to simply viewing the data,
to see the fields that are available in any table that you have permission
to see, click the Data Catalog Browser ![]() icon to the left of the table name. You are redirected to the Data
Catalog Browser. The field names are then shown as in the Schema Fields
table.
icon to the left of the table name. You are redirected to the Data
Catalog Browser. The field names are then shown as in the Schema Fields
table.
Running a Custom Query
To run a custom query, in the Execute Query tab, either modify an existing query, type or paste a query, or click Drag and drop .txt or .sql file here to upload a file containing your SQL code. The following statement types are supported:
-
CREATE
-
DROP
-
TRUNCATE TABLE
-
ALTER
-
INSERT
-
UPDATE
-
DELETE
-
SET OPTION
-
GRANT
-
REVOKE
You may run multiple SQL queries (up to 3,000 characters) at once. Separate statements with semicolons, either directly in the Execute Query tab or in the uploaded file. Statements are executed in order, regardless of whether any previous statements fail.
Viewing Query Output
Whether your query succeeds or fails, your output will be displayed below the Execute Query box.
If you would like to export your results, click Export. Your output is exported as a .xlsx file.
Show History
To rerun a query that has been run previously within the current session:
-
Click History.
The page then displays a list of queries.
-
Drag the query into the Execute Query tab.
-
Click Run Query.
Saving a Query
To save a query, click the data source name on the left side
of the page. A list of tables appears. Press the Save![]() icon
next to the table you would like to save. The table now appears under
the Saved drop-down, and the number to the right
of Saved increases.
icon
next to the table you would like to save. The table now appears under
the Saved drop-down, and the number to the right
of Saved increases.
Alternatively, run a query in the Execute Query tab. Navigate to the History tab, and click the Save icon. The query appears in the Saved tab.