
Develop ObjectScript Unit Tests
The InterSystems® ObjectScript extension for Visual Studio Code (VS Code) leverages VS Code’s testing API and the InterSystems %UnitTest frameworkOpens in a new tab to enable you to run and debug methods from classes which extend %UnitTest.TestCaseOpens in a new tab, right within the VS Code interface.
Regardless of whether you are editing on the client-side or the server-side, you can accelerate development for your ObjectScript project by integrating unit test development into your VS Code workflow.
Prerequisites
Running or debugging ObjectScript tests within a VS Code workspace requires the following:
-
Visual Studio Code version 1.83.0 or later.
-
InterSystems ObjectScript extension for VS Code version 2.12.1 or later.
-
An active server connection to an instance of InterSystems IRIS version 2023.3 or later.
-
The value of the ^UnitTestRoot global for the instance must be set to an existing directory within the local filesystem. (This is required so that the extension can execute unit tests using %UnitTest.Manager methodsOpens in a new tab. The extension does not use the value of ^UnitTestRoot.)
-
Setup
To run or debug ObjectScript tests within VS Code:
-
Open the workspace that you are developing tests in. Tests can be run from a single- or multi-root workspace, client- or server-side. (See Connect a Workspace to Your InterSystems Server.)
Note:You cannot run unit tests within the %SYS namespace of an InterSystems server.
-
Ensure that the ObjectScript extension setting objectscript.unitTest.enabled is set to true for the workspace. (This is the setting’s default value.)
-
For client-side workspace folders: edit the ObjectScript extension setting objectscript.unitTest.relativeTestRoots so that it specifies the relative paths within your workspace folder where your test classes are located. See the User and Workspace SettingsOpens in a new tab section of the VS Code documentation for further guidance with editing settings.
-
If test cases within a test directory require additional resources:
-
For client-side workspace folders: configure and populate an autoload subdirectory, as described in Autoload Client-Side Resources.
-
For server-side workspace folders: ensure that all required resources are already loaded on the server.
-
How the Extension Locates Your Unit Tests
Once you have configured your workspace as described in the preceding steps, the ObjectScript extension locates classes which extend %UnitTest.TestCaseOpens in a new tab and makes them available for running and debugging within the VS Code interface.
-
For a client-side workspace, the extension locates applicable test classes within the directories specified by objectscript.unitTest.relativeTestRoots.
-
For a server-side workspace, the extension locates applicable test classes within all workspace folders which are configured to include them. For example:
-
a server-side workspace folder which includes the contents of a project will display tests if the project includes applicable test classes.
-
a server-side workspace folder which includes the contents of the filter filter=*.mac will not display tests even if there are test classes in the namespace.
-
Within the test directory, the extension ignores test cases which are located in any directory with a name beginning with an underscore character (_) except in such cases where the name of the autoload directory begins with an underscore. This is consistent with the behavior of the %UnitTest.Manager class’s RunTest() method.
If you are editing on the client-side and you export a test class from the server using the ObjectScript Explorer, the extension places that class within a /src/ folder on the client-side workspace, regardless of where the test is stored on the workspace. This may result in duplicate copies of a class in two client-side locations.
When using a client-side editing workflow, InterSystems recommends editing on the client exclusively, and importing changes from the client onto the server.
Autoload Client-Side Resources
When you initiate the running or debugging of a test method in a client-side workspace, the ObjectScript extension can automatically load resources which your test methods require from a subdirectory within the test directory. These resources are loaded into a temporary location onto the server before the test case classes; upon conclusion of the running or debugging session, the extension deletes both the test case classes and the autoload resources from the server.
By default, the extension is configured to autoload UDL and XML files from /_autoload/ if a directory with that name exists. You can modify the name of the autoload directory and control which types of files the extension loads within the InterSystems ObjectScript extension settings.
Run and Debug Your Unit Tests
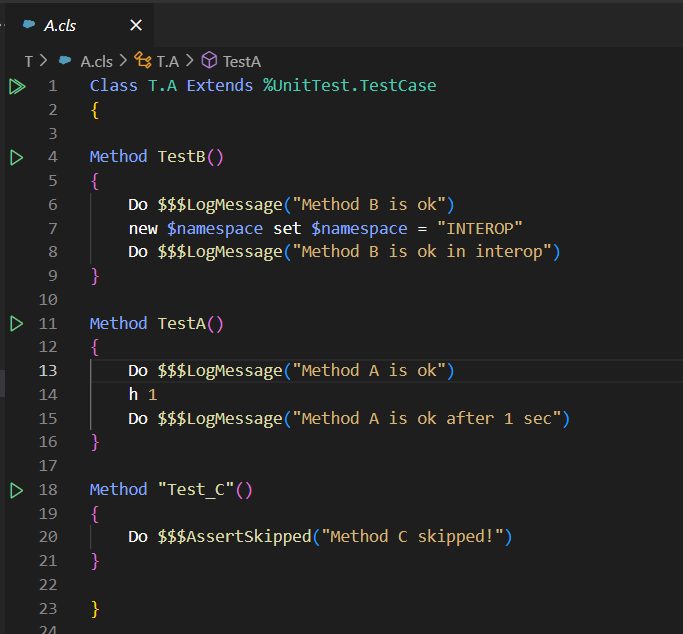
For a test case class which is open in an editor, you can run a test case by selecting the green play button  which appears in as a margin decoration at the start of the method definition (beside the line number). To run all the test methods for the class, select the “play all” button
  at the beginning of the class definition. These margin decorations are visible in the following image:
As shown in the following image, additional options are available by right-clicking one of these play buttons—including the option to debug:
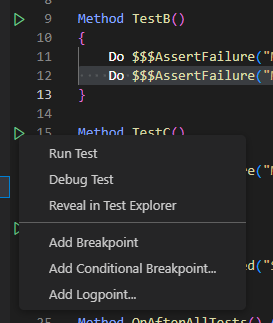
See Run and Debug for further guidance on debugging ObjectScript methods within VS Code.
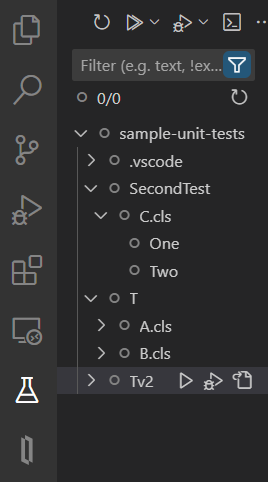
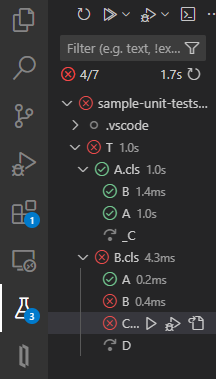
You can also run and debug tests within the Testing Explorer, which is available by selecting the beaker icon  from the Activity Bar. The Testing Explorer presents all the test methods in your workspace in a tree view, as shown in the following image:
In addition to the graphic interfaces, the ObjectScript extension makes a variety of testing-related commands available in the Command Palette. To review a list of these commands, activate the Command Palette and search for “Test:”
View Test Results
After running or debugging a test case, the decoration in the margin of the editor updates to reflect the state of the test result. The editor also allows you to view the output of an individual test inline. Both of these features are visible in the following image:
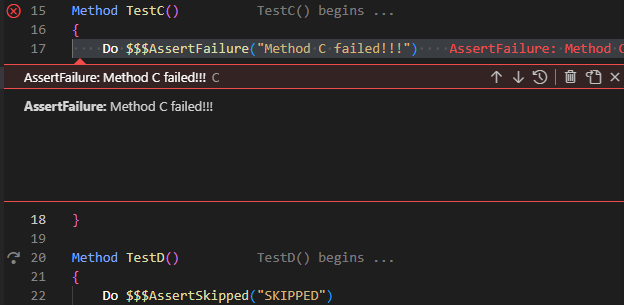
To view test output within the editor in this way, select the Peek Output or Peek Error option from the context menu for the test’s margin decoration, or navigate to the desired test result from the inline output view for another test using the arrow buttons.
After running or debugging a test case, the Testing Explorer also updates to reflect the state of the test result, as depicted in the following image:
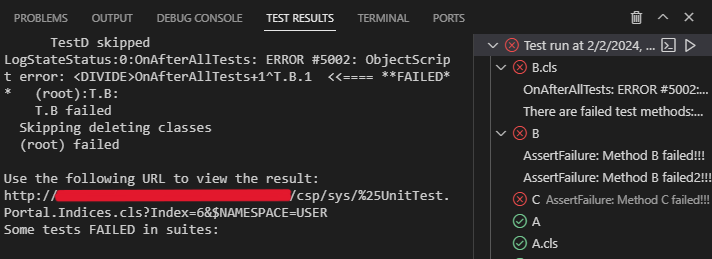
You can also view results for all the tests you’ve run in the Test Results panel, depicted in the image which follows. A side bar provides a collapsible outline of results for any test runs you have not cleared; selecting a result from the sidebar displays a detailed view of results in the primary section of the panel.
You can clear test results by selecting that option from the Test Result panel’s menu bar, the editor’s inline test result view, and the Test Explorer sidebar’s menu bar.