
Run and Debug Your ObjectScript Code
The InterSystems® ObjectScript Extension for Visual Studio Code (VS Code) provides support for ObjectScript debugging. It takes advantage of the debugging capabilities built into VS Code, so you may find these VS Code documentation resources useful:
InterSystems also produced a short videoOpens in a new tab which walks through the steps in this documentation page.
For InterSystems IRIS® 2024.2 and versions of InterSystems IRIS which were released subsequent to that version, the VS Code debugger’s step action buttonsOpens in a new tab can execute a single command at a time. Earlier versions of InterSystems IRIS only support line-level step execution.
By default, the ObjectScript extension executes command-level steps whenever the option is available. You can configure this behavior by modifying the objectscript.debug.stepGranularity setting.
Create a Debug Configuration
To run and debug an ObjectScript class or routine or attach to a running process, you must define a debug configuration within a workspace’s settings file.
To define a debug configuration, perform the following steps:
-
Select the Run and Debug button
 in the Activity Bar to navigate to the debugging view container.
 -
If no debug configurations are available, you are prompted to define one within a launch.json file, as illustrated in the following image:
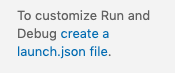
Select the link to create a launch.json file.
-
The link opens a menu of available debug environments, as illustrated in the following image.
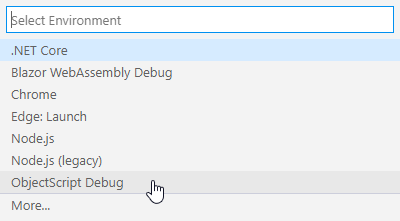
Select the ObjectScript Debug menu option.
-
Once you have chosen a debug environment, VS Code creates and opens a launch.json file which contains the following default content:
{
    "version": "0.2.0",
    "configurations": [
        {
            "type": "objectscript",
            "request": "launch",
            "name": "XDebug"
        }
    ]
}
As needed, edit the defaults for these properties, which are mandatory for all debug configurations:
-
"type" — identifies the type of debugger to use. The value, "objectscript", is supplied by the InterSystems ObjectScript extension.
-
"request" — identifies the type of action for this launch configuration. Possible values are "launch" (to run and debug a class or routine) and "attach" (to attach to a running process).
-
"name" — an arbitrary name to identify the configuration. This name appears in the Start Debugging drop-down list.
-
-
Provide the additional configuration properties relevant to the "request" type:
-
For a "launch" configuration, you must supply the “program” property, which specifies the routine or ClassMethod to run when launching the debugger, as shown in the following example:
{ "version": "0.2.0", "configurations": [ { "type": "objectscript", "request": "launch", "name": "ObjectScript Debug HelloWorld", "program": "##class(Test.MyClass).HelloWorld()", }, { "type": "objectscript", "request": "launch", "name": "ObjectScript Debug GoodbyeWorld", "program": "##class(Test.MyOtherClass).GoodbyeWorld()", } ] }Note:Whereas for some other languages, the debugging environment runs the currently active file by default, the ObjectScript debugging environment requires you to specify the routine or ClassMethod to use.
-
For an "attach" configuration, you may supply the following optional attributes:
-
“processId” — specifies the ID of process to attach to as a string or number. Defaults to "${command:PickProcess}", which provides a drop-down list of process ID’s to attach to at runtime.
-
“system” — specifies whether to allow attaching to system process. Defaults to false.
The following example shows multiple valid ObjectScript “attach” configurations:
{ "version": "0.2.0", "configurations": [ { "type": "objectscript", "request": "attach", "name": "Attach-to-specific-process", "processId": 5678 }, { "type": "objectscript", "request": "attach", "name": "Select-process-at-runtime", "processId": "${command:PickProcess}" }, { "type": "objectscript", "request": "attach", "name": "Select-process-including-system", "system": true } ] } -
-
Starting a Debugging Session
You can select a debug configuration from the list VS Code provides in the Run and Debug field, available in the title bar of the debug view:
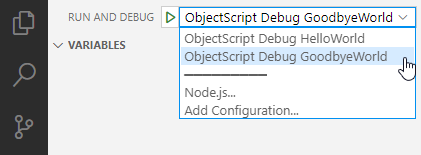
Selecting the green arrow runs the selected debug configuration.
When you start an ObjectScript "launch" debug session, make sure that the file containing the program that you are debugging is open in your editor and is the active tab. VS Code will start a debug session with the server of the file in the active editor (the tab that the user is focused on).
When you start an ObjectScript “attach” debug session from a workspace which has multiple active server connections, the ObjectScript extension prompts you to select the server which contains the process that you want to debug. Otherwise, the extension attempts to attach to the specified process using the current active server connection.
The extension uses WebSockets to communicate with the InterSystems server during debugging. If you are experiencing issues when trying to start a debugging session, check that the InterSystems server’s web server allows WebSocket connections. (If you are using IIS on a Windows system, you may need to enable support for WebSockets manuallyOpens in a new tab.)
Debugging commands and items on the Run menu function much as they do for other languages supported by VS Code. For information on VS Code debugging, see the documentation resources listed at the start of this section.
Debug REST Services
The InterSystems ObjectScript Extension provides a WebviewOpens in a new tab-based graphical user interface that allows you to send a REST request and automatically start debugging the process on the server that handles it. With the InterSystems file that you want to debug open in the active text editor, you can show the GUI using the Debug REST Service... command. The command can be accessed in the Command Palette, the editor context menu, or the editor tab context menu. Follow the directions in the GUI to build your REST request and click the Start Debugging button to send the request and connect the debugger. Be sure you have a breakpoint set somewhere in the code that handles the request.
Troubleshoot Debugger Issues
If you are experiencing issues using the debugger, please follow these steps before opening an issue on GitHub. Note that the trace global may contain confidential information, so you should review the contents and mask/remove anything that you want to keep private.
-
Open the Terminal for the InterSystems IRIS instance you are connecting to, ensuring you are in the namespace which contains the class or routine you are debugging.
-
Run the command Kill ^IRIS.Temp.Atelier("debug"), then Set ^IRIS.Temp.Atelier("debug") = 1. These commands turn on the Atelier API debug logging feature. If you are on Caché or Ensemble, the global to modify in these commands ^CacheTemp.ISC.Atelier("debug").
-
In VS Code, start a debugging session using the configuration that produces the error.
-
When the error appears, copy the contents of the ^IRIS.Temp.Atelier("debug") global. Include this global in your GitHub issue.
-
After you capture the log, run the command Kill ^IRIS.Temp.Atelier("debug"), then Set ^IRIS.Temp.Atelier("debug") = 0. This turns logging off again.
Using the InterSystems Lite Terminal
The InterSystems ObjectScript Extension includes the InterSystems Lite Terminal, a WebSocket-based command-line interface for executing ObjectScript commands on a connected server. The server can be on the same system as VS Code, or a remote system. This feature is only supported when connecting to InterSystems IRIS version 2023.2 or later.
The InterSystems Lite Terminal supports the following features:
-
VS Code’s shell integrationOpens in a new tab feature so your command history and output will be captured by VS Code and can be accessed by its UI.
-
Multi-line editing. An additional editable line will be added when the user presses Enter and there are unclosed { or ( in the command input.
-
Syntax coloring for command input.
-
Syntax checking for entered command input, with detailed error messages reported along with the standard <SYNTAX> error.
-
Many features of the standard terminalOpens in a new tab, including:
-
The Read command
-
Interrupts (Ctrl-C)
-
Namespace switches
-
Custom terminal promptsOpens in a new tab (except code 7)
-
Shells such as SQL (Do $SYSTEM.SQL.Shell()) and Python (Do $SYSTEM.Python.Shell())
-
The InterSystems Lite Terminal does not support command-line debuggingOpens in a new tab, since the InterSystems ObjectScript Extension contains an interactive debugger. Users are also discouraged from using routine editing commandsOpens in a new tab since VS Code with the InterSystems ObjectScript Extension Pack provides an excellent ObjectScript editing experience.
Note that the terminal process starts using the JOB command, so if you have a ^%ZSTART routineOpens in a new tab enabled the JOB subroutine will be called at the start of the process, not LOGIN like the standard terminal. Also, the ZWELCOME routineOpens in a new tab will not run before the first command prompt is shown.
To open the InterSystems Lite Terminal:
-
Open the Command PaletteOpens in a new tab and execute the ObjectScript: Launch Lite Terminal
-
Select InterSystems Lite Terminal from the Terminal panel’s Profiles menuOpens in a new tab.
If your workspace has multiple active server connections, the ObjectScript extension prompts you to select the server for which you want to open an InterSystems Lite Terminal session. If only one server connection is active, the ObjectScript extension opens an InterSystems Lite Terminal session for that server by default.
Troubleshoot InterSystems Lite Terminal Issues
If you are experiencing issues using the InterSystems Lite Terminal, please follow these steps before opening an issue on GitHub. Note that the trace global may contain confidential information, so you should review the contents and mask/remove anything that you want to keep private.
-
If you are using a Microsoft Internet Information Services (IIS) web server to connect, confirm that the IIS WebSocket Protocol feature is enabledOpens in a new tab.
-
Open the Terminal for the InterSystems IRIS instance you are connecting to, ensuring you are in the namespace which contains the class or routine you are debugging.
-
Run the command Kill ^IRIS.Temp.Atelier("terminal"), then Set ^IRIS.Temp.Atelier("terminal") = 1. These commands turn on the Atelier API debug logging feature.
-
In VS Code, launch the InterSystems Lite Terminal and run the commands that produce the error.
-
When the error appears, copy the contents of the ^IRIS.Temp.Atelier("terminal") global. Include this global in your GitHub issue.
-
After you capture the log, run the command Kill ^IRIS.Temp.Atelier("terminal"), then Set ^IRIS.Temp.Atelier("terminal") = 0. This turns logging off again.