Using the SQL Explorer (2.8)
To help you make use of the tables in the system, InterSystems Data Studio™ provides the SQL Explorer. You can use this to examine tables, as well as run custom SQL queries.
Note that the user roles govern both the tables that you have permission to see and the SQL queries you have permission to run.
Introduction
To access the SQL Explorer, click the SQL Explorer
icon in the application menu. This opens a new browser or window, which contains a page of the Management Portal for InterSystems IRIS®, the product embedded within InterSystems Data Studio™.
For your use cases, two areas are of primary interest:
-
The tree on the left, where the Tables folder displays all the tables you have permission to see.
-
The Execute Query tab on the right, which you use to execute SQL queries as described on this page.
The other SQL Explorer options are not necessarily helpful, but if you are interested, see Using the Management Portal SQL InterfaceOpens in a new tab in the latest InterSystems IRIS documentation.
Viewing the Contents of a Table
To view the contents of a table:
-
Click the Tables folder to expand it. The left area then displays all the tables that you have permission to see.
For example:

-
Drag and drop a table name into the large box on the Execute Query tab.
In this box, you will then see an SQL SELECT query that lists all the fields in the table. For example:
SELECT %IRISRowID, fruit, "count", comment, %T_roundcount, %V_CountValidate, %BatchId, %StagingAction FROM Staging_FileDir_step1_v1.sampledatacsv -
Click Execute .
The system then executes that query, internally applying a cutoff so that only the first 1000 records are shown. By default, the system shows data in display mode. For example, this means that a date field is shown in human-readable form. Also, the length of data in a column is restricted to provide a manageable display.
You have the following additional options to refine what you see:
-
Select a different mode; the options are Display Mode (the default), ODBC Mode , and Logical Mode .
-
Specify a different value for the Max field, which limits how many rows of data to return from a query. This can be any non-negative integer, and the maximum is 100,000. (You can also limit the number of rows of data to return by using a TOP clause within the query.) Then click Execute .
-
Edit the query, for example, by reordering or removing fields. Then click Execute .
Viewing Fields in a Table
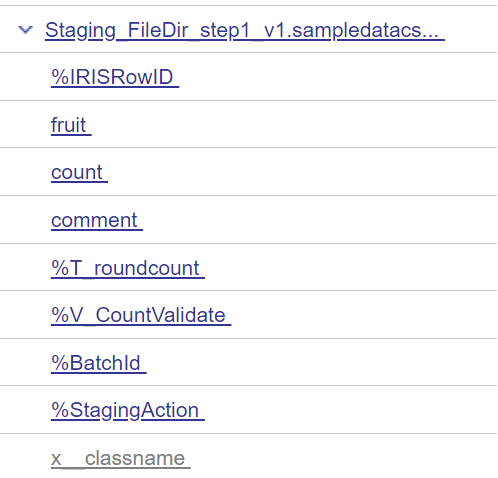
In addition to simply viewing the data , to see the fields that are available in any table that you have permission to see, click the table name in the left area. The field names are then shown as in the following example:

Running a Custom Query
To run a custom query, you view a table as described above and then simply modify the query. Or you can type or paste a query into the large box on the Execute Query tab and then click Execute .
Show History
To rerun a query that has been run previously within the current session:
-
Click Show History .
The page then displays a list of queries.
-
Click Execute in the row for the query you want to rerun.
See Also
-
Using the Management Portal SQL InterfaceOpens in a new tab (in the latest InterSystems IRIS documentation)