
Basic MDX Queries
This page demonstrates basic MDX queries in Business Intelligence.
Also see Accessing the BI Samples.
Contents of the DemoMDX Cube
When you create SQL queries in an unfamiliar database, you start by becoming acquainted with the tables and their columns. Similarly, when you create MDX queries, you start by becoming acquainted with the available cubes and their contents.
-
Start the Terminal.
-
Switch to the namespace into which you loaded the samples.
-
To access the MDX shell, enter the following command:
Do ##class(%DeepSee.Utils).%Shell() -
To see the available cubes, enter the following command (note that it is not case-sensitive):
CUBEThe Terminal then displays a list of cubes.
-
To see the available contents of a cube, enter the following command:
CUBE cubenameFor example:
CUBE demomdxThe shell ignores the case of the command and of the cube name.
The Terminal displays the following:
Measures
  %COUNT
  Age
  Avg Age
  Allergy Count
  Avg Allergy Count
  Test Score
  Avg Test Score
AgeD
    All Patients
  H1
    All Patients
    Age Group
    Age Bucket
AllerD
  H1
    Allergies
BirthD
  H1
    Year
    Quarter Year
BirthQD
  H1
    Quarter
DiagD
  H1
    Diagnoses
GenD
  H1
    Gender
ColorD
  H1
    Favorite Color
HomeD
  H1
    ZIP
    City
DocD
  H1
    Doctor
The DemoMDX cube represents patients. The contents of this cube are as follows:
-
The Measures section lists the available measures: %COUNT, Age, Ave Age, Allergy Count, and so on. These measures are associated with patients and can be aggregated across patients.
-
The Dimensions section contains dimensions. This cube contains the dimension AgeD, AllerD, and so on.
For now, a dimension is the container for one or more hierarchies; for more detail, see Working with Dimensions and Hierarchies.
-
The first element within a dimension is a hierarchy. By convention, in this sample, each dimension contains one hierarchy named H1.
For now, a hierarchy is the container for one or more levels; for more detail, see Working with Dimensions and Hierarchies.
-
The elements within a hierarchy are levels. This cube includes the levels Age, Age Group, Gender, ZIP, City, and others. These levels enable you to select different groups of patients.
In many MDX applications, the same name is used for a dimension, a hierarchy in it, and a level in that hierarchy. This practice can be confusing for someone who is learning MDX, so this sample cube uses the following arbitrary naming conventions:
-
Dimension names are short and end with the letter D.
-
Each dimension contains one hierarchy named H1.
-
Level names are meant to be user friendly. (In the Analyzer, users see both dimension and level names but primarily work with levels.)
As you will see later, in InterSystems MDX, you can omit parts of identifiers. The naming conventions in this sample make it clear which parts can be omitted.
A cube can also contain calculated members and named sets. The CUBE command in the MDX shell does not display these elements, although you can use them in the shell and elsewhere.
The Simplest Query
In the MDX shell, enter the following MDX query (this is not case-sensitive):
SELECT FROM demomdx
The shell displays the results as follows:
Result: 1,000
This query simply counts patients.
MDX is not case-sensitive except for member keys, which are discussed in Working with Levels.
Members
A key component of an MDX query is the member. Each level contains one or more members. For example, the City level contains multiple members, one for each city in the data. A level enables you to select records; specifically, each member of the level allows you to access a subset of the records.
In the DemoMDX cube, each member of each level in this cube allows you to select some group of patients.
In this section, we execute a simple query to see members of a level in the DemoMDX cube:
-
In the MDX shell, enter the following MDX query (this is not case-sensitive):
SELECT homed.h1.city.MEMBERS ON ROWS FROM demomdxThe shell displays the members of the City level, as follows:
1 Cedar Falls                           110
2 Centerville                            99
3 Cypress                               112
4 Elm Heights                           118
5 Juniper                               122
6 Magnolia                              114
7 Pine                                  121
8 Redwood                               111
9 Spruce                                 93
For now, let us discuss only the member names, which are shown in the second column.
The City level contains the members Cedar Falls, Centerville, Cypress, and so on. Each member of this level represents the set of patients with that home city. For example, the Centerville member represents all patients whose home city is Centerville.
Measures
Another key component of an MDX query is the measure. All InterSystems IRIS Business Intelligence queries use at least one measure. If you do not specify a measure, the system uses the default measure defined in the cube. For most cubes, the default measure is %COUNT, which is a count of the records. Let us examine some of the measures in the sample cube:
-
In the MDX shell, enter the following simple query:
SELECT MEASURES.[%COUNT] ON COLUMNS FROM demomdxThis query returns a result set that contains one column of data — the aggregate value for the %COUNT measure — across the entire data set that the cube represents. Depending on the data in your sample, the shell displays something like the following:
                                    %COUNT
                                      1,000
In this example, there are 1000 patients.
-
In the MDX shell, enter the following query:
SELECT MEASURES.[avg test score] ON COLUMNS FROM demomdxThis query returns a result set that shows the aggregate value for the Avg Test Score measure across the entire data set.
Depending on the data in your sample, the shell displays something like the following:
                            Avg Test Score
                                      74.75
This number is the average test score across all patients.
Referring to Members and Measures
In the preceding sections, you explored the elements of the DemoMDX cube, in particular its measures and levels, and you should have some sense of the data contained in it. You also wrote simple MDX queries. The next step is to learn the syntax that you use to refer to members and measures:
-
To refer to a member:
[dimension_name].[hierarchy_name].[level_name].[member_name] -
To refer to all members of a level:
[dimension_name].[hierarchy_name].[level_name].MEMBERSMEMBERS is the MDX function that returns the members of the level. The InterSystems MDX Reference provides reference information for all MDX functions that Business Intelligence supports.
-
To refer to a measure:
[MEASURES].[measure_name]
Note the following variations:
-
In any of these names, you can omit the square brackets ([]) if the name consists only of alphanumeric characters.
For a more formal discussion of identifiers, see the section Identifiers in the InterSystems MDX Reference.
-
When referring to a level or member, you can omit the hierarchy name. If you do, MDX uses the first level with the given name, as defined in this dimension. (This variation is an InterSystems extension to MDX.)
-
When referring to a member, you can omit the level name. If you do, MDX uses the first member with the given name, as defined within this dimension. (This variation is an InterSystems extension to MDX.)
You cannot omit the dimension name.
The following examples are all equivalent in InterSystems MDX:
[GenD].[H1].[GENDER].Female
[GenD].Female
GenD.H1.GENDER.Female
GenD.H1.Female
GenD.Female
Simple MDX Queries with %COUNT
This section presents simple forms of MDX queries, which do not refer to a measure and thus use the default measure defined in the cube (which is usually %COUNT).
-
To use the members of a given level as columns, use a query of the following form:
SELECT [dim_name].[hier_name].[lev_name].MEMBERS ON COLUMNS FROM cubename -
To use the members of one level as columns and use members of another level as rows, use a query of the following form:
SELECT [dim_name].[hier_name].[lev_name].MEMBERS ON COLUMNS, [dim_name].[hier_name].[lev_name].MEMBERS ON ROWS FROM cubenameNote:Do not include the line break that is shown here. The documentation includes this line break only for readability (especially in the printed form of the content). The MDX shell does not permit this line break.
-
To use a single member as a column, use a query of the following form:
SELECT [dim_name].[hier_name].[lev_name].[member_name] ON COLUMNS FROM cubename
You can use 0 instead of COLUMNS, and you can use 1 instead of ROWS. (For reasons of space, this documentation uses 0 and 1 rather than COLUMNS and ROWS.)
In all cases, the SELECT statement returns a result set, which the MDX shell displays in tabular form.
Let us try queries that use these variations:
-
Enter the following MDX query:
SELECT gend.h1.gender.MEMBERS ON 0 FROM demomdxThe shell executes the query and displays the results like the following (yours will be slightly different):
                              Female                 Male
                                  488                  512
Notice the following:
-
Because the query did not specify a measure, the numbers shown are values for %COUNT, which counts the patients.
-
There are two members shown as columns (or on the column axis of the result set). The Female member refers to the female patients, and Male refers to the male patients.
-
-
Try a shorter version of the same query:
SELECT gend.gender.MEMBERS ON 0 FROM demomdxThis query returns the same data as the previous query.
-
Now enter the following variation:
SELECT gend.gender.female ON 0 FROM demomdxThe result might be like the following:
                                    Female
                                        488
In this example, the query selected a specific member rather than both members of this dimension.
-
Try this variation (with the member name in a different case):
SELECT gend.gender.FEMALE ON 0 FROM demomdxThis returns the same result as the preceding query.
-
Enter a slightly more complex query:
SELECT gend.h1.gender.MEMBERS ON 0,homed.h1.zip.MEMBERS ON 1 FROM demomdxThe shell executes the query and displays the results like the following:
                              Female                 Male
1 32006                           105                  110
2 32007                            58                   53
3 34577                           173                  174
4 36711                            41                   58
5 38928                           111                  117
In this case, the results contain multiple rows, one row for each patient ZIP code. The counts are shown for each ZIP code, by gender.
If there are multiple rows of results, the MDX shell displays a column that indicates the row numbers of the results.
Axis Skipping
In other implementations of MDX, you cannot omit an axis if you use a higher-numbered axis. That is, you cannot use ROWS unless you also use COLUMNS.
In InterSystems MDX, however, if you omit COLUMNS, the system uses %COUNT, as follows:
SELECT gend.h1.gender.MEMBERS ON ROWS FROM demomdx

1 Female                                488
2 Male                                  512
Sets
In MDX, the columns and the rows are axes of the query and of the result set. The following result set, for example, has gender on the column axis and home ZIP codes on the row axis:
                              Female                 Male
1 32006                           105                  110
2 32007                            58                   53
3 34577                           173                  174
4 36711                            41                   58
5 38928                           111                  117
An axis uses a set. The general syntax for a set expression is as follows:
{expression1, expression2, ...}
This list can include any number of items. In InterSystems MDX, if the list includes only one item, you can omit the curly braces. Also, a set can be empty, but if so cannot be used on a query axis.
Within the set, each expression can be one of the following:
-
A member expression, which is either of the following:
-
An explicit reference to a single member by name. For example:
[PatDim].[GENDERH1].[GENDER].[F] -
An expression that uses an MDX function to return a single member. For example:
[PatDim].[GENDERH1].[GENDER].[F].NEXTMEMBER(NEXTMEMBER is the MDX function that returns the next member of the level. Working With Levels introduces this and other functions.)
-
-
An expression that uses an MDX function, like MEMBERS, to return a set. For example:
[dimension_name].[hierarchy_name].[level_name].MEMBERS
There are other forms of expressions and other kinds of set elements; see Working With Sets and the InterSystems MDX Reference.
You can use any non-null set expression within a SELECT statement. In general, SELECT has the following basic syntax for a query that uses one axis:
SELECT set_expression ON COLUMNS FROM cubename
Or:
SELECT set_expression ON 0 FROM cubename
The following form is a query that uses two axes:
SELECT set_expression ON COLUMNS,set_expression ON ROWS FROM cubename
Or:
SELECT set_expression ON 0,set_expression ON 1 FROM cubename
A SELECT statement can use additional axes, but the shell does not display their results in a readable form.
Examples
Now try some query variations that use different kinds of sets, as shown in the preceding section.
-
The following example uses a set created by a comma-separated list:
SELECT {gend.h1.gender.MEMBERS,homed.h1.city.MEMBERS} ON 0 FROM demomdx

                   Female      Male   Cedar F   Centerv   Cypress   Elm Hei ...
                       488       512       110        99       112       118...
As you can see, the results have too many columns to be shown in full.
-
Try a variation that uses the same set as rows instead of columns:
SELECT {gend.h1.gender.MEMBERS,homed.h1.city.MEMBERS} ON 1 FROM demomdx 1 Female 488 2 Male 512 3 Cedar Falls 110 4 Centerville 99 5 Cypress 112 6 Elm Heights 118 7 Juniper 122 8 Magnolia 114 9 Pine 121 10 Redwood 111 11 Spruce 93 -
Let us expand the preceding by moving gender to the columns and adding home ZIP codes as another set of rows:
SELECT gend.h1.gender.MEMBERS ON 0,{homed.h1.city.MEMBERS,homed.h1.zip.MEMBERS} ON 1 FROM demomdx Female Male 1 Cedar Falls 58 52 2 Centerville 41 58 3 Cypress 51 61 4 Elm Heights 53 65 5 Juniper 58 64 6 Magnolia 58 56 7 Pine 64 57 8 Redwood 58 53 9 Spruce 47 46 10 32006 105 110 11 32007 58 53 12 34577 173 174 13 36711 41 58 14 38928 111 117 -
Try using a member multiple times within a set:
SELECT gend.h1.gender.MEMBERS ON 0,{homed.h1.[36711],homed.h1.[36711]} ON 1 FROM demomdx

                              Female                 Male
1 36711                            41                   58
2 36711                            41                   58
Displaying Measures
Any MDX query uses at least one measure. If you do not indicate the measure to use, the system uses the default measure defined in the cube, usually %COUNT, which is a count of the records. There are multiple ways to display other measures. This section introduces a couple of them.
To use measures in queries, you can do the following:
-
You can display a measure as a column and optionally display a set as rows. For example:
SELECT MEASURES.[avg allergy count] ON 0,colord.MEMBERS ON 1 FROM demomdx Avg Allergy Count 1 None 1.08 2 Blue 1 3 Green 1.05 4 Orange 1.16 5 Purple 1.22 6 Red 1.06 7 Yellow 0.94 -
You can display a measure as a row and optionally display a set as columns — the reverse of the preceding. For example:
SELECT gend.h1.gender.MEMBERS ON 0, MEASURES.[avg test score] ON 1 FROM demomdx Female Male Avg Test Score 73.49 74.42 -
You can create a set of multiple measures and use that set as rows or columns. For example:
SELECT {MEASURES.[%COUNT],MEASURES.[avg test score]} ON 0,colord.MEMBERS ON 1 FROM demomdx %COUNT Avg Test Score 1 None 239 72.68 2 Blue 124 76.94 3 Green 106 72 4 Orange 148 72.89 5 Purple 135 74.87 6 Red 121 74.92 7 Yellow 127 74.41 -
You can use the CROSSJOIN function as follows:
SELECT CROSSJOIN(MEASURES.[%COUNT],gend.h1.gender.MEMBERS) ON 0, diagd.h1.diagnoses.MEMBERS ON 1 FROM demomdx

                              Female                 Male
1 None                            399                  429
2 asthma                           46                   44
3 CHD                              14                   23
4 diabetes                         23                   22
5 osteoporosis                     21                    1
(For a more general introduction to this function, see Combining Sets. )
-
You can use the MEMBERS function to display all measures (except for %COUNT), as follows:
SELECT gend.MEMBERS ON 0, MEASURES.MEMBERS ON 1 FROM demomdx

                              Female                 Male
1 Age                          18,413               17,491
2 Avg Age                       37.73                34.16
3 Allergy Count                   326                  332
4 Avg Allergy Count              1.08                 1.07
5 Test Score                   29,542               31,108
6 Avg Test Score                73.49                74.42
Including a Simple Filter in the Query
An MDX query can also include a filter, which reduces the number of rows of the fact table that the query could potentially use. To add a filter to a query, add a clause like the following to the end of your SELECT statement:
WHERE filter_details
For filter_details, the simplest form is as follows:
[dim_name].[hier_name].[level_name].[member_name]
You can use the same variations here as described in Referring to Members and Measures, earlier in this page.
This expression filters the query so that the system accesses only the records associated with this member. For example, the following query uses only patients who have osteoporosis:
SELECT MEASURES.[%COUNT] ON 0,aged.[age bucket].MEMBERS ON 1 FROM demomdx WHERE diagd.osteoporosis

                                    %COUNT
1 0 to 9                                  *
2 10 to 19                                *
3 20 to 29                                *
4 30 to 39                                *
5 40 to 49                                *
6 50 to 59                                *
7 60 to 69                                7
8 70 to 79                                7
9 80+                                     8
The MDX shell uses an asterisk (*) to indicate that a value is null.
Filtering a Query discusses WHERE in more detail.
Understanding the Contents of the MDX Results
Now that you have seen a variety of MDX queries and their results, it is time to review the results more formally. The MDX shell presents the results for an MDX query in the following general form:
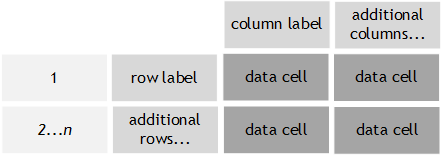
The following rules determine the results:
-
If the output includes multiple rows of results, the first column contains the row number (nnn, starting with 1 for the first row) for easy reference. If there is only one row of results, this column is not included.
This column of numbers is shown only in the MDX shell and is not part of the result set.
-
The output contains one column of data cells for each member of the set that you use on the column axis.
-
In general, each column label corresponds to the name of the corresponding member, which might be a measure or might be a regular member.
-
If you do not specify a set for the rows, the output contains one row with no label.
-
If you specify a set for the rows, the output contains one row for each member of that set. The label for a given row is the name of the corresponding member, which might be a measure or might be a regular member (that is, a member that is not a measure).
-
For any given data cell, the output displays either a value or an asterisk (*). The asterisk indicates that the value is null.
To determine the value to use, the system finds the intersection of the member used for the column and the member (if any used) for the row:
-
If one member is a measure and the other is not a measure, the system finds the value of that measure for that member. For example, if one member is the Ave Age measure, and the other member is the 34577 ZIP code, then the corresponding data cell contains the average age of patients whose home ZIP code is 34577.
-
If neither member is a measure, the system uses the default measure, which is usually %COUNT. For example, if one member is the gender F, and the other member is the 34577 ZIP code, then the corresponding data cell contains the count of all female patients whose home ZIP code is 34577.
-
If both members are measures, the system uses the measure that is on the Columns axis.
(Note that if both members are calculated measures, the system also considers SOLVE_ORDER. For details, see SOLVE_ORDER Clause in the InterSystems MDX Reference.)
-
Notes on Independence of Query Axes
The system considers each query axis independently of the others. Sometimes the result is counter-intuitive. This section shows two examples.
Set Order Is Unaffected by Other Sets in the Query
In all cases, it is important to remember that the order of the set returned is independent of any other sets used in the query, and sometimes the result is counter-intuitive. For example, consider the following query:
SELECT MEASURES.[%COUNT] ON 0,
TOPCOUNT(homed.city.MEMBERS,100,MEASURES.[%COUNT]) ON 1 FROM demomdx

                                    %COUNT
1 Juniper                               122
2 Pine                                  121
3 Elm Heights                           118
4 Magnolia                              114
5 Cypress                               112
6 Redwood                               111
7 Cedar Falls                           110
8 Centerville                            99
9 Spruce                                 93
This query shows the sort order that you obtain when you sort cities by patient count. (In this example, the number of members to select is 100, which is greater than the number of members; therefore all members are shown.)
If you modify the preceding query to return the top three members, you see the following:
SELECT MEASURES.[%COUNT] ON 0, TOPCOUNT(homed.city.MEMBERS,3,MEASURES.[%COUNT]) ON 1 FROM demomdx

                                    %COUNT
1 Juniper                               122
2 Pine                                  121
3 Elm Heights                           118
Now consider the results when you break out the patients by gender:
SELECT CROSSJOIN(MEASURES.[%COUNT],gend.gender.MEMBERS) ON 0,
TOPCOUNT(homed.city.MEMBERS,3,Measures.[%COUNT]) ON 1 FROM demomdx

                              Female                 Male
1 Juniper                          58                   64
2 Pine                             64                   57
3 Elm Heights                      53                   65
The cities are listed in the same order in this query as in the preceding query, which did not specify a breakout for the columns. In this example, Juniper is the top-rated city by total patient count and so appears first. That is, the sorting is controlled by the total patient count in a city, not by any of the displayed values.
Set Membership Is Unaffected by Other Sets in the Query
It is also important to remember that the members of the returned set are independent of any sets used in the query, and sometimes the result is counter-intuitive. For example, consider the following query:
SELECT MEASURES.[%COUNT] ON 0, TAIL(birthd.year.MEMBERS,10) ON 1 FROM demomdx

                                    %COUNT
 1 1912                                   3
 2 1918                                   1
 3 1919                                   1
 4 1920                                   4
 5 1921                                   2
 6 1922                                   1
 7 1923                                   2
 8 1924                                   1
 9 1925                                   2
10 1927                                   5
Now consider the results when we show only a single gender:
SELECT CROSSJOIN(gend.male,MEASURES.[%COUNT]) ON 0, HEAD(birthd.year.MEMBERS,10) ON 1 FROM demomdx

                                    %COUNT
 1 1912                                   *
 2 1918                                   *
 3 1919                                   *
 4 1920                                   1
 5 1921                                   *
 6 1922                                   *
 7 1923                                   2
 8 1924                                   *
 9 1925                                   1
10 1927                                   1
The birth years are the same as in the preceding query, which shows data aggregated across genders.
Business Intelligence Name Resolution
In some cases, it is possible for multiple entities of the same type to have the same name. For example, an MDX cube can have two levels with the same name, as long as they are in different hierarchies (or possibly different dimensions). Suppose that the cube command showed the contents of a cube as follows:
...
Dimensions
  Geography
    ShipToHierarchy
      State
      City
    OrderByHierarchy
      State
      City
In Business Intelligence, you can omit the hierarchy name when you refer to a level. If the dimension contains multiple levels with the same name, the system uses the first level with the given name. To refer to a level unambiguously, include the hierarchy name as well.
For another example, a level can have multiple members with the same name. Different states could have cities that have the same name, and those cities are different members. Or if your cube has a fine-grained level such as doctor name, that level could contain multiple members with the same name. In Business Intelligence, if you refer to the member by name, you access the first member of that name within the level. To refer to a member unambiguously, use its key. See Member Keys.
Nonexistent Members
In most cases, for a nonexistent member, the system returns null, which the shell represents as an asterisk (*). For example, consider the following query:
SELECT colord.h1.color.pink ON 0 FROM demomdx

                                 No Member
                                          *
The exception is for measures, which are members of the MEASURES dimension. For a nonexistent measure, the system returns an error. For example:
SELECT MEASURES.[pat count] ON 0 FROM demomdx

ERROR #5001: Measure not found: pat count
Typographical Errors
In most situations, the system treats typographical errors in the same way that it treats nonexistent members. For example:
SELECT colord.h1.color.MEMBERSSS ON 0 FROM demomdx

                                 No Member
                                          *
For another example:
SELECT colord.MEMBERSSS ON 0 FROM demomdx

                                 No Member
                                          *
When you refer to a dimension or an element within a dimension, however, the dimension name is required. If you mistype the dimension name, the system treats that as an error:
SELECT colorddd.h1.color.MEMBERS ON 0 FROM demomdx

ERROR #5001: Dimension not found: colorddd
If you mistype the name of the cube or subject area, the system treats that as an error:
SELECT colord.h1.color.MEMBERS ON 0 FROM demo

ERROR #5001: Cannot find Subject Area: 'DEMO'
Conventions Used in the Documentation
For reasons of space, the rest of this documentation uses the following conventions:
-
It uses 0 and 1 rather than COLUMNS and ROWS.
-
It omits the square brackets in dimension, hierarchy, level, and member names, wherever possible. (See the section Identifiers in the InterSystems MDX Reference.)
-
It omits the hierarchy names except where needed. (This is permitted in InterSystems MDX.)
Also, to help you quickly scan query examples:
-
MDX statements, keywords, and functions are shown in uppercase.
-
Cube elements and other user-supplied details are given in lowercase, except in running text.