
Introduction to Business Intelligence
This page introduces InterSystems IRIS Business Intelligence, which enables you to embed business intelligence (BI) into your applications.
You can use Business Intelligence only in a specifically configured web application. See Setting Up the Web Application. Also, be sure to consult InterSystems Supported Platforms for information on system requirements.
Purpose
The purpose of InterSystems Business Intelligence is to enable you to embed business intelligence (BI) into your applications so that your users can ask and answer sophisticated questions of their data. Specifically, your application can include dashboards, which can include the following:
-
Interactive widgets that execute queries designed for specific user roles or for specific areas of your user interface.
-
Controls such as drop-down lists and data choosers that enable users to modify these queries.
-
Interactive drill options that enable users to view the displayed data in different ways.
-
Options to export, print, and send alerts to other users.
-
An option to launch the Mini Analyzer, which supports free-form analysis.
-
Execute custom actions that are provided as buttons or other controls.
In contrast to traditional BI systems that use static data warehouses, Business Intelligence is kept closely in synchronization with the live transactional data, as required for your business.
Dashboard Visual Details
The following example shows a sample dashboard:
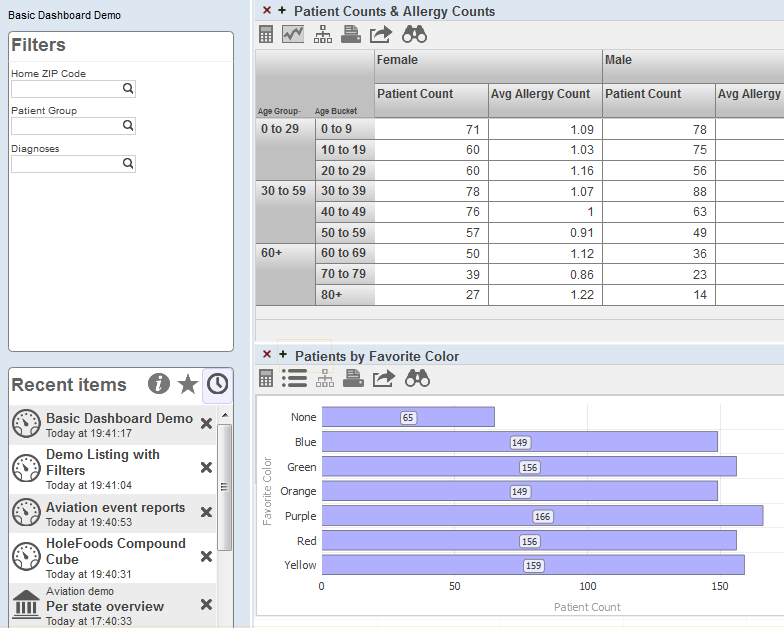
A dashboard consists of the following areas:
-
The upper left displays the name of the dashboard and (if defined) its title.
-
Depending on the system configuration and on the individual layout of a dashboard, a dashboard can include zero, one, or two worklist areas on the left. For any worklist area, the upper right corner displays icons to indicate which worklists it can display. For example:
The highlighted icon indicates which worklist is currently displayed. You can select a different icon to display the corresponding worklist in this area instead.
The Filters worklist is specific to the dashboard. You use this to filter the widgets shown on this dashboard.
-
The right area contains one or more widgets. Each widget is a rectangular panel that displays data in some form.
The following subsection describes the more common widgets.
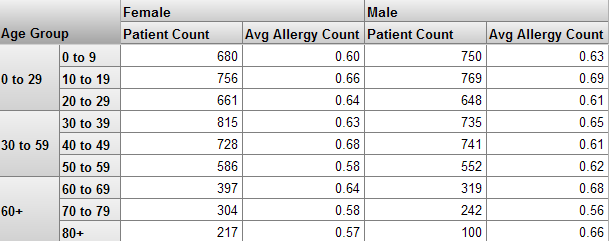
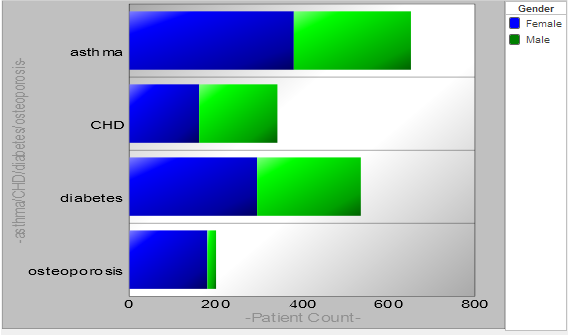
Pivot Table Widgets
A pivot table widget displays data in one of three formats. First, it can display the data as a table:
Second, it can display the data as a chart:
Third, it can display a detail listing, which is a table that shows selected fields from the lowest-level records:
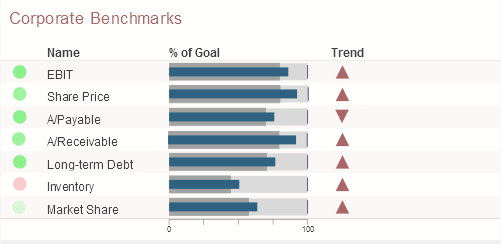
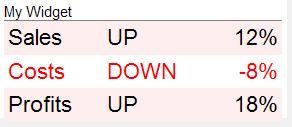
Scorecard Widgets
A scorecard widget displays one or more rows of data in a tabular format that also includes features such as value-dependent lamps and arrows. For example:
Meter Widgets
A meter widget displays one or more values, each in a graphical object as follows:
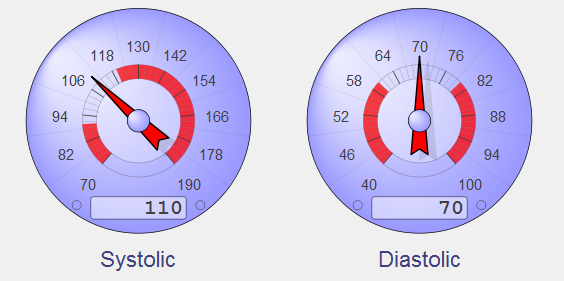
The preceding picture shows values in a speedometer. Business Intelligence supports several other forms of meters.
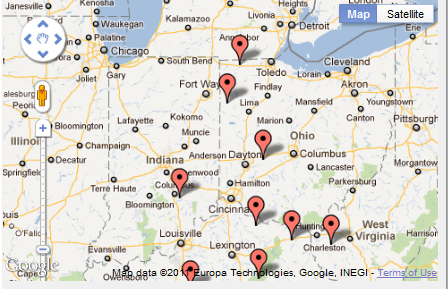
Map Widgets
A map widget shows a map with highlighted points that typically correspond to locations that are relevant to your business scenario:
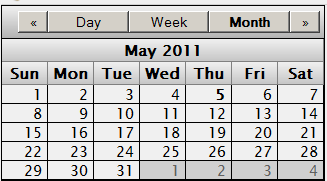
Calendar Widgets
A dashboard can include an informational calendar widget like the following:
Custom Widgets
A dashboard can also include custom widgets called portlets. The following shows an example:
Data Sources for Widgets
In a dashboard, most widgets use a data source, which is one of the following:
-
A pivot table. Pivot tables are created in the Analyzer. A pivot table is a query based on a cube, which is part of a Business Intelligence model. The following section discusses Business Intelligence models.
-
A KPI (key performance indicator). A KPI is a more advanced query created by a programmer; it is also part of a Business Intelligence model.
Business Intelligence Models
A Business Intelligence model includes some or all of the following elements:
-
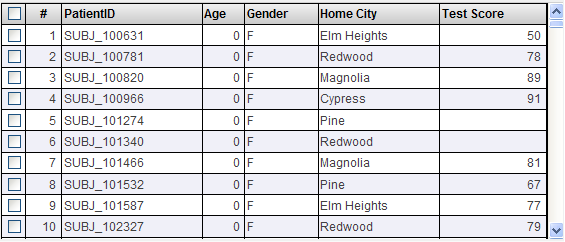
At least one cube definition. A cube describes ways that you can query a set of specific base elements (such as patients or transactions). A cube includes levels, which enable you to group records from the base set, and measures, which show aggregate values of those records. It also defines listings and other items.
You use a cube to create pivot tables. For example:
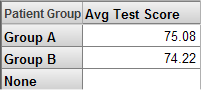
In this pivot table, the rows correspond to the members of the Patient Group level; each member is shown as one row. The data column displays the aggregate value of the Avg Test Score measure for each of these members; for this measure, the system computes the average value. Notice that the Avg Test Score is null for the None patient group.
-
Any number of subject areas. A subject area is a subcube that enables users to focus on smaller sets of data without the need for multiple cubes. A subject area also enables you to customize captions and defaults of the cube.
-
Any number of KPIs (key performance indicators). In Business Intelligence, a KPI is an interactive dataset that can be displayed on a dashboard. It uses a custom query created by a programmer. The query can use SQL, MDX (MultiDimensional Expressions, which is also generated by the Analyzer), or custom code.
The KPI can also define actions, which a user can launch and which execute your custom code.