
Editing a BPL Diagram
This page describes how to make changes in a BPL diagram, when viewing the diagram in the BPL Editor.
Introduction to BPL Diagrams
A BPL diagram consists of shapes that correspond to activities in a BPL file, with additional shapes and connections that correspond to logic in the BPL file. The following is an example.
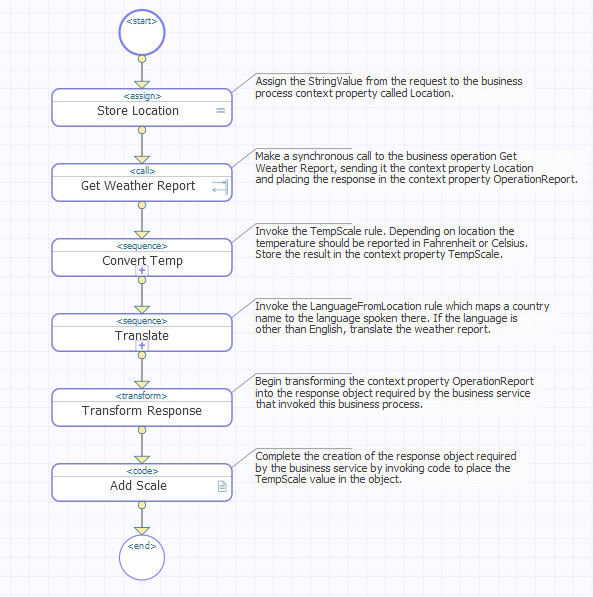
In general the interior color of a BPL diagram shape is white, with a blue outline. If the shape is in error, its outline is red. If the shape is disabled, its interior color is gray, with a gray outline.
Setting BPL Diagram Preferences
The Preferences tab contains the following settings that apply to the appearance of the BPL diagram:
-
Gridlines—Select one of the following choices for the appearance of the grid lines on the diagram: None, Light, Medium, or Dark.
-
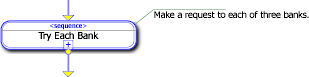
Show annotations—Reveal or hide the text notes that explain each shape. When you reveal annotations, they appear to the upper right of each shape that has an <annotation> element in the BPL document.
-
Auto arrange—Cause each new shapes in the diagram to automatically conform to a structured arrangement without needing to select
 after adding each shape.
Changing the position of shapes does not change the underlying BPL code.
Editing Tips
When using the BPL Editor to work with a BPL diagram, you can:
-
Select a shape by clicking it. Its attributes display in the Activity tab, where you can edit their values. Its interior color changes to yellow. If it is in error, its outline remains red; if not, its outline changes to a bolder blue. When you select a disabled shape it shows a dotted outline.
-
Select multiple shapes by holding down the Ctrl key while selecting.
To clear the selection of a shape, click on it while it is selected.
-
Connect one element to another by clicking on its input or output connection point and dragging to the desired element. The tool does not allow you to make an illegal connection.
-
Display or edit the properties of an element by selecting it and viewing its properties in the Activity tab to the right. You can also select a connector to see its properties; click the other property tabs to see the properties of the process itself.
-
Insert and connect a new shape in one operation: select the connector between the two elements where the new shape should go, then add an activity. The new shape appears between the existing elements with connections automatically in place.
-
Automatically validate activities as you add them to the diagram. If InterSystems IRIS® detects an element with a logical error, it displays a red warning on the Activity tab for the element along with the reason for the error.
BPL Diagram Shapes
A BPL diagram uses certain shapes to indicate that a BPL element is present in the code.
| BPL Shape | Meaning | Example |
|---|---|---|
 |
Activity * | <assign>, <call>, <sync>, and most others. |
 |
Loop | <foreach>, <while>, or <until>. Reveal the loop details by clicking on the arrow at the bottom of the shape, or by clicking  |
 |
Sequence | <catch>, <catchall>, or <sequence>. Reveal the sequence by clicking on the plus sign at the bottom of the shape, or by selecting the shape, or by clicking |
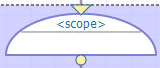 |
Scope | The start of a BPL <scope> for error handling purposes. A shaded rectangular background encloses all the BPL elements that fall within this <scope>. If the <scope> includes a <faulthandlers> element, the rectangle includes a horizontal dashed line across the middle; the area below this line displays the contents of the <faulthandlers>. For examples, see the topic Handling Errors in BPL. |
 |
Decision | The start of an <if>, <switch>, or <branch>. |
 |
Special | <alert>, <reply>, or <label>. |
 |
Split | The start of a BPL <flow> element, where various logical paths diverge from a single point |
 |
Join | The end of any branching element—<if>, <flow>, <branch>, <scope>, or <switch>—where all possible paths come together. |
 |
Start/End | The start or end of a BPL diagram. |
* Many activity shapes display an icon, as shown in the right portion of the <call> activity box. The following table lists and describes the meaning of these icons.
| Icon | BPL Element | Icon | BPL Element | Icon | BPL Element | ||
|---|---|---|---|---|---|---|---|
| <assign> | <code> | <sql> | |||||
| Asynchronous <call> | <delay> | <sync> | |||||
| Synchronous <call> | <milestone> | <trace> | |||||
| <catch> | <rule> |
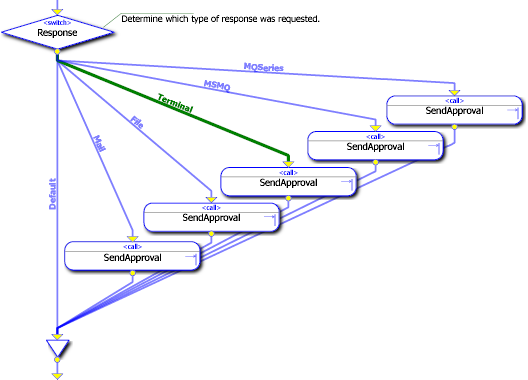
When a shape represents a complex activity such as <if> or <switch> that has multiple branches, joins, or other types of related shapes elsewhere in the BPL diagram, clicking on one of these shapes highlights the related shapes in green with a purple outline. Clicking on a <sync> element highlights the <call> elements that it synchronizes. Clicking on an <if> shape highlights the Join where the <true> and <false> branches come together, and so on. For example:
BPL Diagram Connections
In a BPL diagram, the lines between shapes specify logical relationships and sequencing among the elements. These lines are called connections. The start of each line is a circular nub and the end is a triangular point. One triangular input nub and one circular output nub are built into each shape that you add to the BPL diagram.
You can connect one shape to another by clicking on its input or output nub and dragging the cursor to the desired shape. When you release the mouse, a connection appears. Another way to connect shapes is to insert and auto-connect a new shape in one step. Select the two elements on either side of where the new shape should go. You can select multiple elements by holding down the Ctrl key while clicking on the shapes. If two elements are selected with no existing connection between them, you can add a new shape and it appears between the existing elements, with connections automatically in place. To add a new shape between two connected elements, click on the connection to highlight it, then add the new element. The new shape appears between the existing elements, with connections automatically in place.
Once two shapes are connected, the connection is preserved no matter where you drag the respective shapes. You can drag shapes to any layout position you wish, within the same diagram. Connections reroute automatically, and the underlying BPL document is not changed. On the other hand, if you change the logic of the connections, for example to reorder calls, create loops, or cut and paste, then the underlying BPL document does change to reflect your actions in the BPL Editor.
Within a <switch> activity, each possible path is automatically labeled with the corresponding <switch> value. All of the possible paths from a <switch> activity converge at a Join shape before a single arrow connects from the Join shape to the next activity in the BPL diagram.
The BPL Editor validates your diagram as you work on it. For example, the editor detects if the output branches of an <if>, <flow>, or <switch> element are connected to the wrong Join shape in the diagram. If so, the connector that is in error displays in red until you correct the diagram.
BPL Diagram Layout
After you add shapes or create new connections, you can tidy the diagram by clicking the arrange icon on the tool bar.
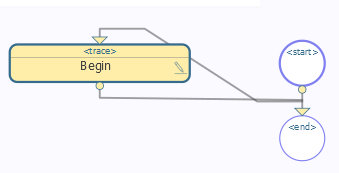
For example, if you do not have the auto arrange feature set in your preferences, when you add a shape to a BPL diagram it looks something like the following figure.
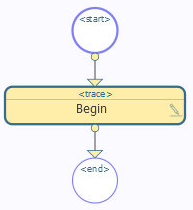
When you click the auto arrange tool the shapes are aligned as shown in the following figure.
If you want your diagrams to always use this type of structured layout, select the Auto arrange check box on the Preferences tab.
By default, when you open a BPL diagram for the first time, the auto arrange feature is enabled. This choice may or may not be appropriate for a particular drawing. You can disable automatic arrangement to ensure that your diagram always displays with exactly the layout you want by clearing the Auto arrange check box on the Preferences tab. This way, when the diagram is displayed, it does not take on any layout characteristics except what you have specified.
Drilling Down into a BPL Diagram
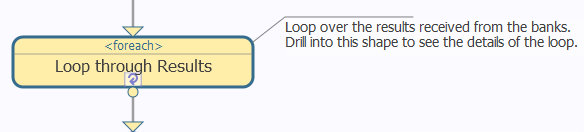
A loop activity displays a cyclic arrow to indicate that it provides drill-down details. The following is an example of the <foreach> loop activity. Others include <while> and <until>. For example:
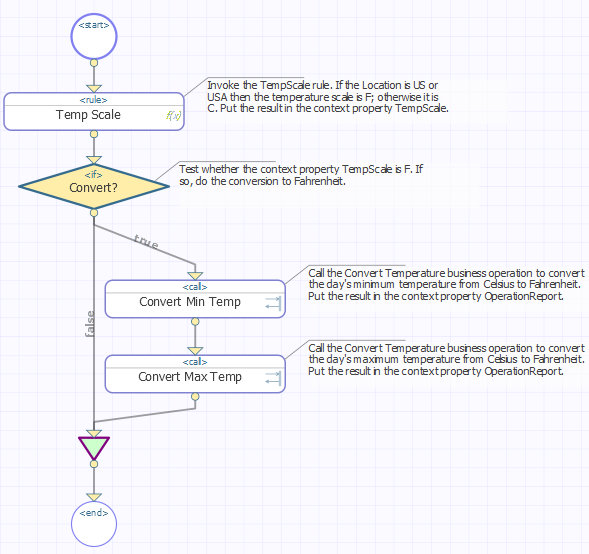
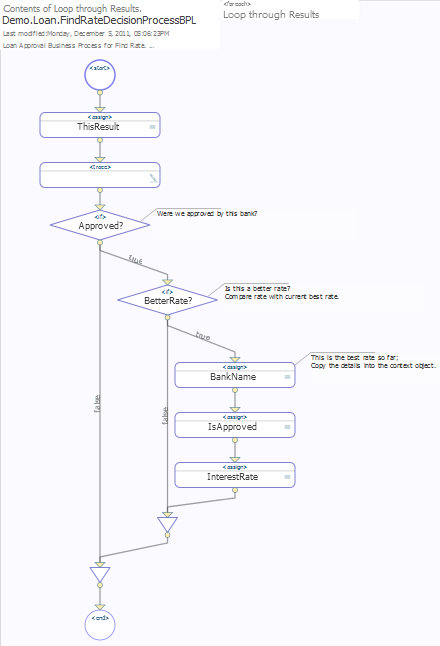
If you select the loop activity and then click the tool or click the ![]() in the loop shape, a BPL diagram of the loop displays. This is a full BPL diagram showing all the logic between the start and end of the loop. For example:
in the loop shape, a BPL diagram of the loop displays. This is a full BPL diagram showing all the logic between the start and end of the loop. For example:
To return to the higher logical level, where one shape represents the entire loop, click the  tool.
tool.
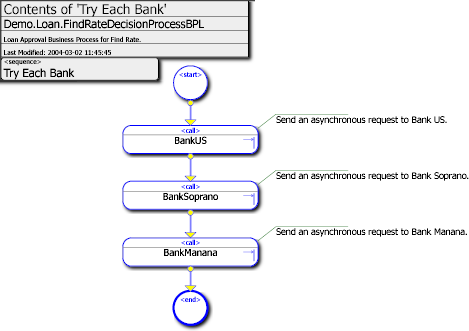
A sequence displays a plus sign to indicate that it, too, can provide drill-down details. For example:
When you drill down into a sequence, the resulting BPL diagram shows all the logic between the start and end of the sequence. To return to the higher logical level, where one shape represents the entire sequence, click the tool. For example:
If there is an error anywhere in a lower-level diagram, the BPL Editor highlights the group shape (<foreach>, <sequence>, <while>, or <until>) in red. To fix the error, you must drill down into the group shape to see the activity that has the error highlighted in red in the lower-level diagram.
Adding Activities to a BPL Diagram
The Add Activity list enables you to add items to the BPL diagram. The list is divided into the following categories:
-
Activities
Adds this Activity View documentation for this element Alert <alert> Assign <assign> Break <break> Call <call> Code <code> Continue <continue> Delay <delay> Empty <empty> Reply <reply> Rule <rule> SQL <sql> Sync <sync> Trace <trace> Transform <transform> XPATH <xpath> XSLT <xslt> -
Decisions and Placeholders
Adds this Decision View documentation for this element If <if> Switch <switch> Branch <branch> Label <label> Milestone <milestone> -
Logic
Adds this Logic View documentation for this element Flow <flow> Join (required for the diagram, no corresponding BPL element) Scope <scope> Sequence <sequence> -
Loops
Adds this Loop View documentation for this element ForEach <foreach> While <while> Until <until> -
Error Handling
Adds this Loop View documentation for this element Throw <throw> Catch <catch> Catch All <catchall> Compensate <compensate> Compensation Handler <compensationhandlers>
When you add an element to the diagram, the Activity tab displays with the properties applicable to the element. At the top of the tab is the corresponding BPL element and a description along with an active link to the BPL reference entry for that element. This is the most accurate place to get information about the settings that follow.
Except for the <start> and <end> shapes, the following settings are common to all elements:
Enter a name for the caption inside the shape.
The x axis coordinate for the location of the selected shape in the diagram.
The y axis coordinate for the location of the selected shape in the diagram.
Select this check box to disable the activity; clear it to enable. The default is enabled.
Enter text to appear as comments next to the shape in the diagram.
The <start> and <end> shapes only have the x and y coordinates, so you can move them manually if you wish.
Adding a Call Activity
A common task in a BPL business process is to add a Call activity. The following information is necessary to properly create a new <call> to one of the available business processes or business operations in the production:
-
Input
-
Output
-
Name
-
Target
-
Request