Defining Measures
This page describes how to define measures in a Business Intelligence cube.
The system automatically creates a measure whose default name is Count. To override this default name, specify the Count measure caption option for the cube; see Specifying Cube Options.
Also see Accessing the Business Intelligence Samples.
Adding a Measure
To add a measure, drag a class property from the Class Viewer and drop it onto the Measures label in the Model Viewer. Then make changes if needed in the Details Area.
Or do the following:
-
Click Add Element.
The system displays a dialog box.
-
For Enter New Item Name, type a measure name.
-
Click Measure.
-
Click OK.
-
Select the measure in the Model Viewer.
-
Specify the following options, at a minimum:
-
Type — Specifies the measure type, as described in Specifying the Measure Type.
-
Property or Expression — Specifies the source values. See Defining the Source Values for a Dimension or Level and Details for Source Expressions.
-
Aggregate — Specifies how to aggregate the measure values, as described in Specifying How to Aggregate a Measure.
-
Specifying the Measure Type
The Type option specifies the kind of data the measure expects in the source data, as well as the type used in the generated fact table, as follows:
| Measure Type | Expected Type of Source Data | Type Used by Measure | Measure Details |
|---|---|---|---|
| number (this is the default) | Numeric data | %DoubleOpens in a new tab | Numeric value. Default aggregation is SUM. |
| integer | Numeric data (any fractional values are removed by truncation) | %IntegerOpens in a new tab | Integer value. Default aggregation is SUM. |
| age | Date/time data in $Horolog format | %IntegerOpens in a new tab | Age value in days. Can be used only with AVG (default), MIN, and MAX aggregations. Age measures are not generally recommended, unless you perform nightly full cube rebuilds or nightly selective builds of those age measures. |
| date | Date/time data in $Horolog format | %DeepSee.Datatype.dateTimeOpens in a new tab | Date value (in $Horolog format, with seconds removed). Can be used only with AVG, MIN, and MAX (default) aggregations. |
| boolean | 0 or 1 | %BooleanOpens in a new tab | Boolean value that can be aggregated. Default aggregation is COUNT. |
| string | Any | %StringOpens in a new tab | String values to be stored in the fact table; these are not indexed. Can be used only with COUNT. This measure cannot be dragged and dropped in the Analyzer. |
| iKnow* | Text values | %GlobalCharacterStreamOpens in a new tab or %StringOpens in a new tab, depending on the selected source | Text values to be processed and indexed using the NLP Smart Indexing API. This measure cannot be dragged and dropped in the Analyzer. |
*For information on the iKnow type, see Advanced Modeling for InterSystems Business Intelligence.
Specifying How to Aggregate a Measure
The Aggregate option specifies how to aggregate values for this measure, whenever combining multiple records. If you specify this, use one of the following values:
-
SUM (the default) — Adds the values in the set.
-
COUNT — Counts the records for which the source data has a non-null (and nonzero) value.
-
MAX — Uses the largest value in the set.
-
MIN — Uses the smallest value in the set.
-
AVG — Calculates the average value for the set.
For a boolean or a string measure, select COUNT.
Specifying a Searchable Measure
You can specify that a measure is searchable; if so, you can filter records used in a pivot table by the value of that measure.
To specify a measure as searchable, select the Searchable check box in the Details Area.
A searchable measure cannot include square brackets or commas ([],) in its name.
Specifying a Format String
The Format string option enables you to specify the display format for the data. You can override this formatting in the Analyzer (or in manually written MDX queries). To specify the formatting for a measure in the Architect, do the following while the measure is displayed:
-
Click the Find button
 .
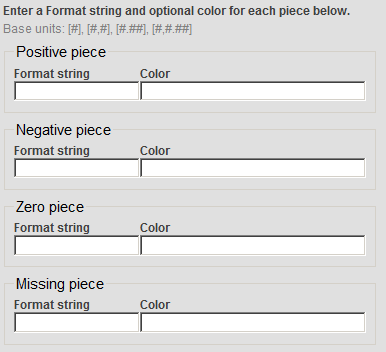
.The system displays a dialog box that includes the following fields:

Here:
-
Positive piece specifies the format to use for positive values.
-
Negative piece specifies the format to use for negative values.
-
Zero piece specifies the format to use for zero.
-
Missing piece specifies the format to use for missing values; this is not currently used.
In each of these, Format string specifies the numeric format, and Color specifies the color.
The details are different for date-type measures; see the next section.
-
-
Specify values as needed (see the details after these steps).
-
Click OK.
Format String Field
The Format string field is a string that includes one of the following base units:
| Base Unit | Meaning | Example |
|---|---|---|
| # | Display the value without the thousands separator. Do not include any decimal places. | 12345 |
| #,# | Display the value with the thousands separator. Do not include any decimal places. This is the default display format for positive numbers. | 12,345 |
| #.## | Display the value without the thousands separator. Include two decimal places (or one decimal place for each pound sign after the period). Specify as many pound signs after the period as you need. | 12345.67 |
| #,#.## | Display the value with the thousands separator. Include two decimal places (or one decimal place for each pound sign after the period). Specify as many pound signs after the period as you need. | 12,345.67 |
| %time% | Display the value in the format hh:mm:ss, assuming that the value indicates the number of seconds. This is useful for measures that display time durations. | 00:05:32 |
Note that InterSystems IRIS displays the thousands separator and the decimal separator as determined by the server locale (see Using the Locale to Control the Names of Time Members.). The locale, however, does not affect the syntax shown in the first column of the preceding table.
You can include additional characters before or after the base unit.
-
If you include a percent sign (%), the system displays the value as a percentage. That is, it multiplies the value by 100 and it displays the percent sign (%) in the position you specify.
-
Any other characters are displayed as given, in the position you specify.
The following table shows some examples:
| Example formatString | Logical Value | Display Value |
|---|---|---|
| formatString="#,#;(#,#);"
Note that this corresponds to the default way in which numbers are displayed. |
6608.9431 | 6,609 |
| –1,234 | (1,234) | |
| formatString="#,#.###;" | 6608.9431 | 6,608.943 |
| formatString="#%;" | 6 | 600% |
| formatString="$#,#;($#,#);" | 2195765 | $2,195,765 |
| –3407228 | ($3,407,228) |
Color Piece
For the Color field, specify either of the following:
-
A CSS color name such as MediumBlue or SeaGreen. You can find these at https://www.w3.org/TR/css3-color/Opens in a new tab and other locations on the Internet.
-
A hex color codeOpens in a new tab such as #FF0000 (which is red).
-
An RGB value such as rgb(255,0,0) (which is red).
Specifying a Format String for a Date Measure
To specify the format string for a date measure, enter one of the following into the Format string field in the Details pane of the Architect:
| Format string | How This Affects the Format of the Measure | Example formatting |
|---|---|---|
| %date% | Date uses the default date format for the current process. | |
| %date%^color Where color is a color as described in Color Piece, in the previous section. | Date uses the default date format for the current process and also is displayed in the given color. | |
| ^color | Date is displayed in the given color. |
Changing the Order of Measures in the Cube
To change the order of measures in the cube:
-
Click Reorder.
The system displays a dialog box.
-
Click Measures.
-
Optionally click Alphabetize to alphabetize them.
This affects the list immediately. You can then reorganize the list further if needed. Also, when you add measures, they are not automatically alphabetized.
-
Click the name of a measure and then click the up or down arrow as needed.
-
Repeat as needed for other measures.
-
Click OK.
The order of the measures in the cube affects how they are displayed in the Analyzer. It does not have any other effect. Some customers choose to alphabetize their measures for convenience; others put more-often used measures at the top of the list.
Specifying the Field Names in the Fact Table
When you compile a cube class, the system generates a fact table class and some related classes. When you build a cube, the system populates these tables, which are described in Details for the Fact and Dimension Tables.
By default, the system generates the names of the columns in the fact table, but you can specify the column names to use instead. To do so, specify a value for the Field name in fact table option for each measure. This option is not available for NLP measures. Take care to use unique names.
For Field name in fact table, be sure not to use an SQL reserved word. For a list of the SQL reserved words, see Reserved Words. The name must start with either a letter or a percent sign (%). If the first character is %, the second character must be Z or z. For more details on restrictions, see Class Members. Also, do not use fact or listing, in any combination of lowercase and uppercase characters.
Specifying Additional Filtering for Listings
By default, when a user displays a detail listing, the system displays one row for each source record that is used in the current context (that is, the context in which the listing was requested). For a given measure, you can specify an additional filter for the system to use when displaying the detail listing. For example, consider the Avg Test Score measure in the Patients sample. This measure is based on the TestScore property, which is null for some patients. You could redefine this measure to filter out those patients, when the user starts on the Avg Test Score measure and then displays a listing.
If you need such a filter, you include it as part of the measure definition. In most cases, the filter has the following form:
measure_value operator comparison_value
This filter is added to the detail listing query and removes any records that do not meet the filter criteria.
The other form of listing filter is MAX/MIN. If you use such a listing filter, the detail listing shows only the records that have the maximum (or minimum) value of the measure. The measure must use the same kind of aggregation as does the listing filter (if a listing filter is included).
To specify an additional filter for listings, for a specific measure:
-
Select the measure in the Model Viewer.
If you intend to use MAX for the listing filter, select a measure that is defined with Aggregate as MAX.
Similarly, if you intend to use MIN, select a measure that is defined with Aggregate as MIN.
-
In the section Measure-Specific Listing Filter (in the Details Area), specify the following values:
-
Operator — Select one of the following: < <= > >= <> = MAX MIN
-
Value — Specify the comparison value. Omit this option if Operator is MAX or MIN
-
When you use this option, the Architect automatically enables the Searchable check box, because this measure must be searchable.
Example
Suppose that we modify the Avg Test Score measure in the Patients cube, and we specify Operator as <> and Value as "". That is, we want to filter out the patients that have null test scores. Then consider the following pivot table:

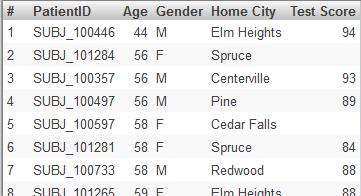
If we click the Patient Count cell (or the Avg Age cell) in the CHD row and then display a detail listing, we see something like this:

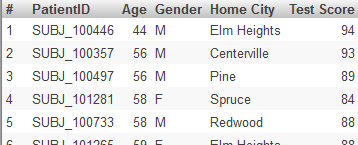
But if we click the Avg Test Score cell in the pivot table and then display a detail listing, we see fewer records, like this:
