
Introduction to the DTL Editor
The DTL Editor (the Data Transformation Builder page) enables you to create, edit, and compile DTL transformations. To access this page in the Management Portal, select Interoperability > Build > Data Transformations.
After a period of inactivity, the InterSystems Management Portal may log you out and discard any unsaved changes. Inactivity is the time between calls to the InterSystems IRIS server. Not all actions constitute a call to the server. For example, clicking Save constitutes a call to the server, but typing in a text field does not. Consequently, if you are editing a data transformation, but have not clicked Save for longer than Session Timeout threshold, your session will expire and your unsaved changes will be discarded. After a logout, the login page appears or the current page is refreshed. For more information, see Automatic Logout Behavior in the Management Portal.
Starting with 2025.1, the product includes a new DTL editor. To access this application, click Try the new UI on the existing DTL Editor. See Introduction to the New DTL Editor.
A First Look at the Page
When you display the DTL editor, it shows the last transformation you opened in this namespace, if any. This page has the following areas:
-
The ribbon bar that the top displays options you can use to create and open DTL transformations, compile the currently displayed transformation, change the zoom display of the diagram, and so on.
For information on these options, see Creating Data Transformations.
-
The upper part of the left area displays the DTL diagram.
-
The lower part of the left area displays a table that lists the actions defined in the DTL transformation. When InterSystems IRIS uses this transformation, it performs these actions in order as listed here.
-
The right area displays three tabs:
-
Transform—Enables you to edit information about the transformation. For details, see Specifying Transformation Details.
-
Action—Enables you to edit details of the selected action. Other topics describe the details for assign actions and for other kinds of actions.
-
Tools—Enables you to launch a wizard to test the currently displayed transformation. For details, see Testing Data Transformations.
-
-
You can resize these three areas.
Introduction to the DTL Diagram
The following shows the DTL diagram for a DTL class:

Note the following points:
-
The left area displays the source message. The header above the column displays the name of the source message class, and the boxes in the column display properties of the source message.
-
The right area displays the target message in the same way.
-
The top area includes a scroll button for each of these areas.
-
The diagram shows connectors that represent actions within the transformations. The actions displayed here copy values from source properties to target properties.
-
The center divider (the blue column) displays an icon on each connector line. The purpose of these icons is to enable you to select the connectors more easily. (You can select a connector line anywhere on its length, but it is easier to click the icons shown in this center divider.)
The following shows another example:
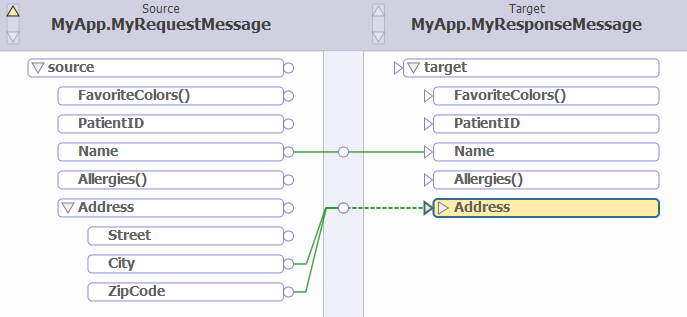
In this case, the source and target classes are more complex. Note the following additional points:
-
The FavoriteColors property is defined as list of strings. This property is displayed here with parentheses () at the end of its name.
In this example, Allergies is another collection property.
-
The Address property is defined as an object that has the Street, City, and ZipCode properties. Notice that the box for this property contains a triangle inside it.
In the left column, this property is displayed in expanded mode, so that you can see the properties. The triangle in the box is not solid and is pointing down.
The right column, this property is displayed in collapsed mode. The triangle in this box is solid and is pointing to the right.
-
For the Address properties, the connector is shown with a dashed line on the side where the Address is collapsed. This indicates that there are hidden sub-properties on this side of the assign action.
Controlling the Display
You can control the display of the Data Transformation Builder page in multiple ways:
-
You can click one of the View options in the ribbon bar:

Use the buttons to view both the transform diagram and the action list in the left pane of the page, or instead to collapse the section you do not want to see.
-
You can select a zoom option from the drop-down list in the ribbon bar. By default, this list displays 100%. Click a value in the list to shrink or enlarge the size of the DTL diagram.
-
Use the scroll bars in the header area of the DTL diagram.
-
Collapse and expand the display of properties in the DTL diagram.