
Build an Interactive Application with Streamlit
Once you are comfortable querying InterSystems IRIS® data platform using DB-API and SQLAlchemy, you can start building interactive applications that work with your data. This section introduces how to use Streamlit to explore and visualize data from InterSystems IRIS interactively and build web applications and dashboards
Prerequisites
Before starting this exercise, make sure that you have installed SQLAlchemy and DB-API using the following command:
pip install sqlalchemy-intersystems-iris
See the DB-API exercise for a brief description of these tools.
You also need to install Streamlit:
pip install streamlit
This particular application uses Pandas to help parse data more easily and Plotly Express to create interactive visualizations. Make sure to install them as well for this application:
pip install pandas plotly
You should also have access to a running InterSystems IRIS instance and valid connection credentials (host, port, username, password, namespace).
Building Interactive Apps with Streamlit and InterSystems IRIS
StreamlitOpens in a new tab is a Python framework that allows developers to build interactive web applications with minimal code. You do not need to know HTML, CSS, or JavaScript. When paired with InterSystems IRIS and SQLAlchemy, it becomes a powerful tool for creating data-driven dashboards, query interfaces, and lightweight front ends.
This section walks through a complete Streamlit application that connects to InterSystems IRIS, runs SQL queries, visualizes data, and uploads CSV files into the database.
Building Your First Streamlit InterSystems IRIS App
In this section, you build a fully functional Streamlit application that connects to InterSystems IRIS to query data, create visualizations, and even allow to file uploads to update your InterSystems IRIS database—all using Python.
You create a lightweight, interactive web interface where users can:
-
Connect to an InterSystems IRIS database and run custom SQL queries.
-
View query results in an interactive table.
-
Download results as CSV files.
-
Visualize numeric data with Plotly charts.
-
Upload CSV files and insert their contents into existing InterSystems IRIS tables.
This app is great for data analysts, data engineers, or developers who want a quick and intuitive interface for working with their InterSystems IRIS data, without needing to build a full web front end from scratch.
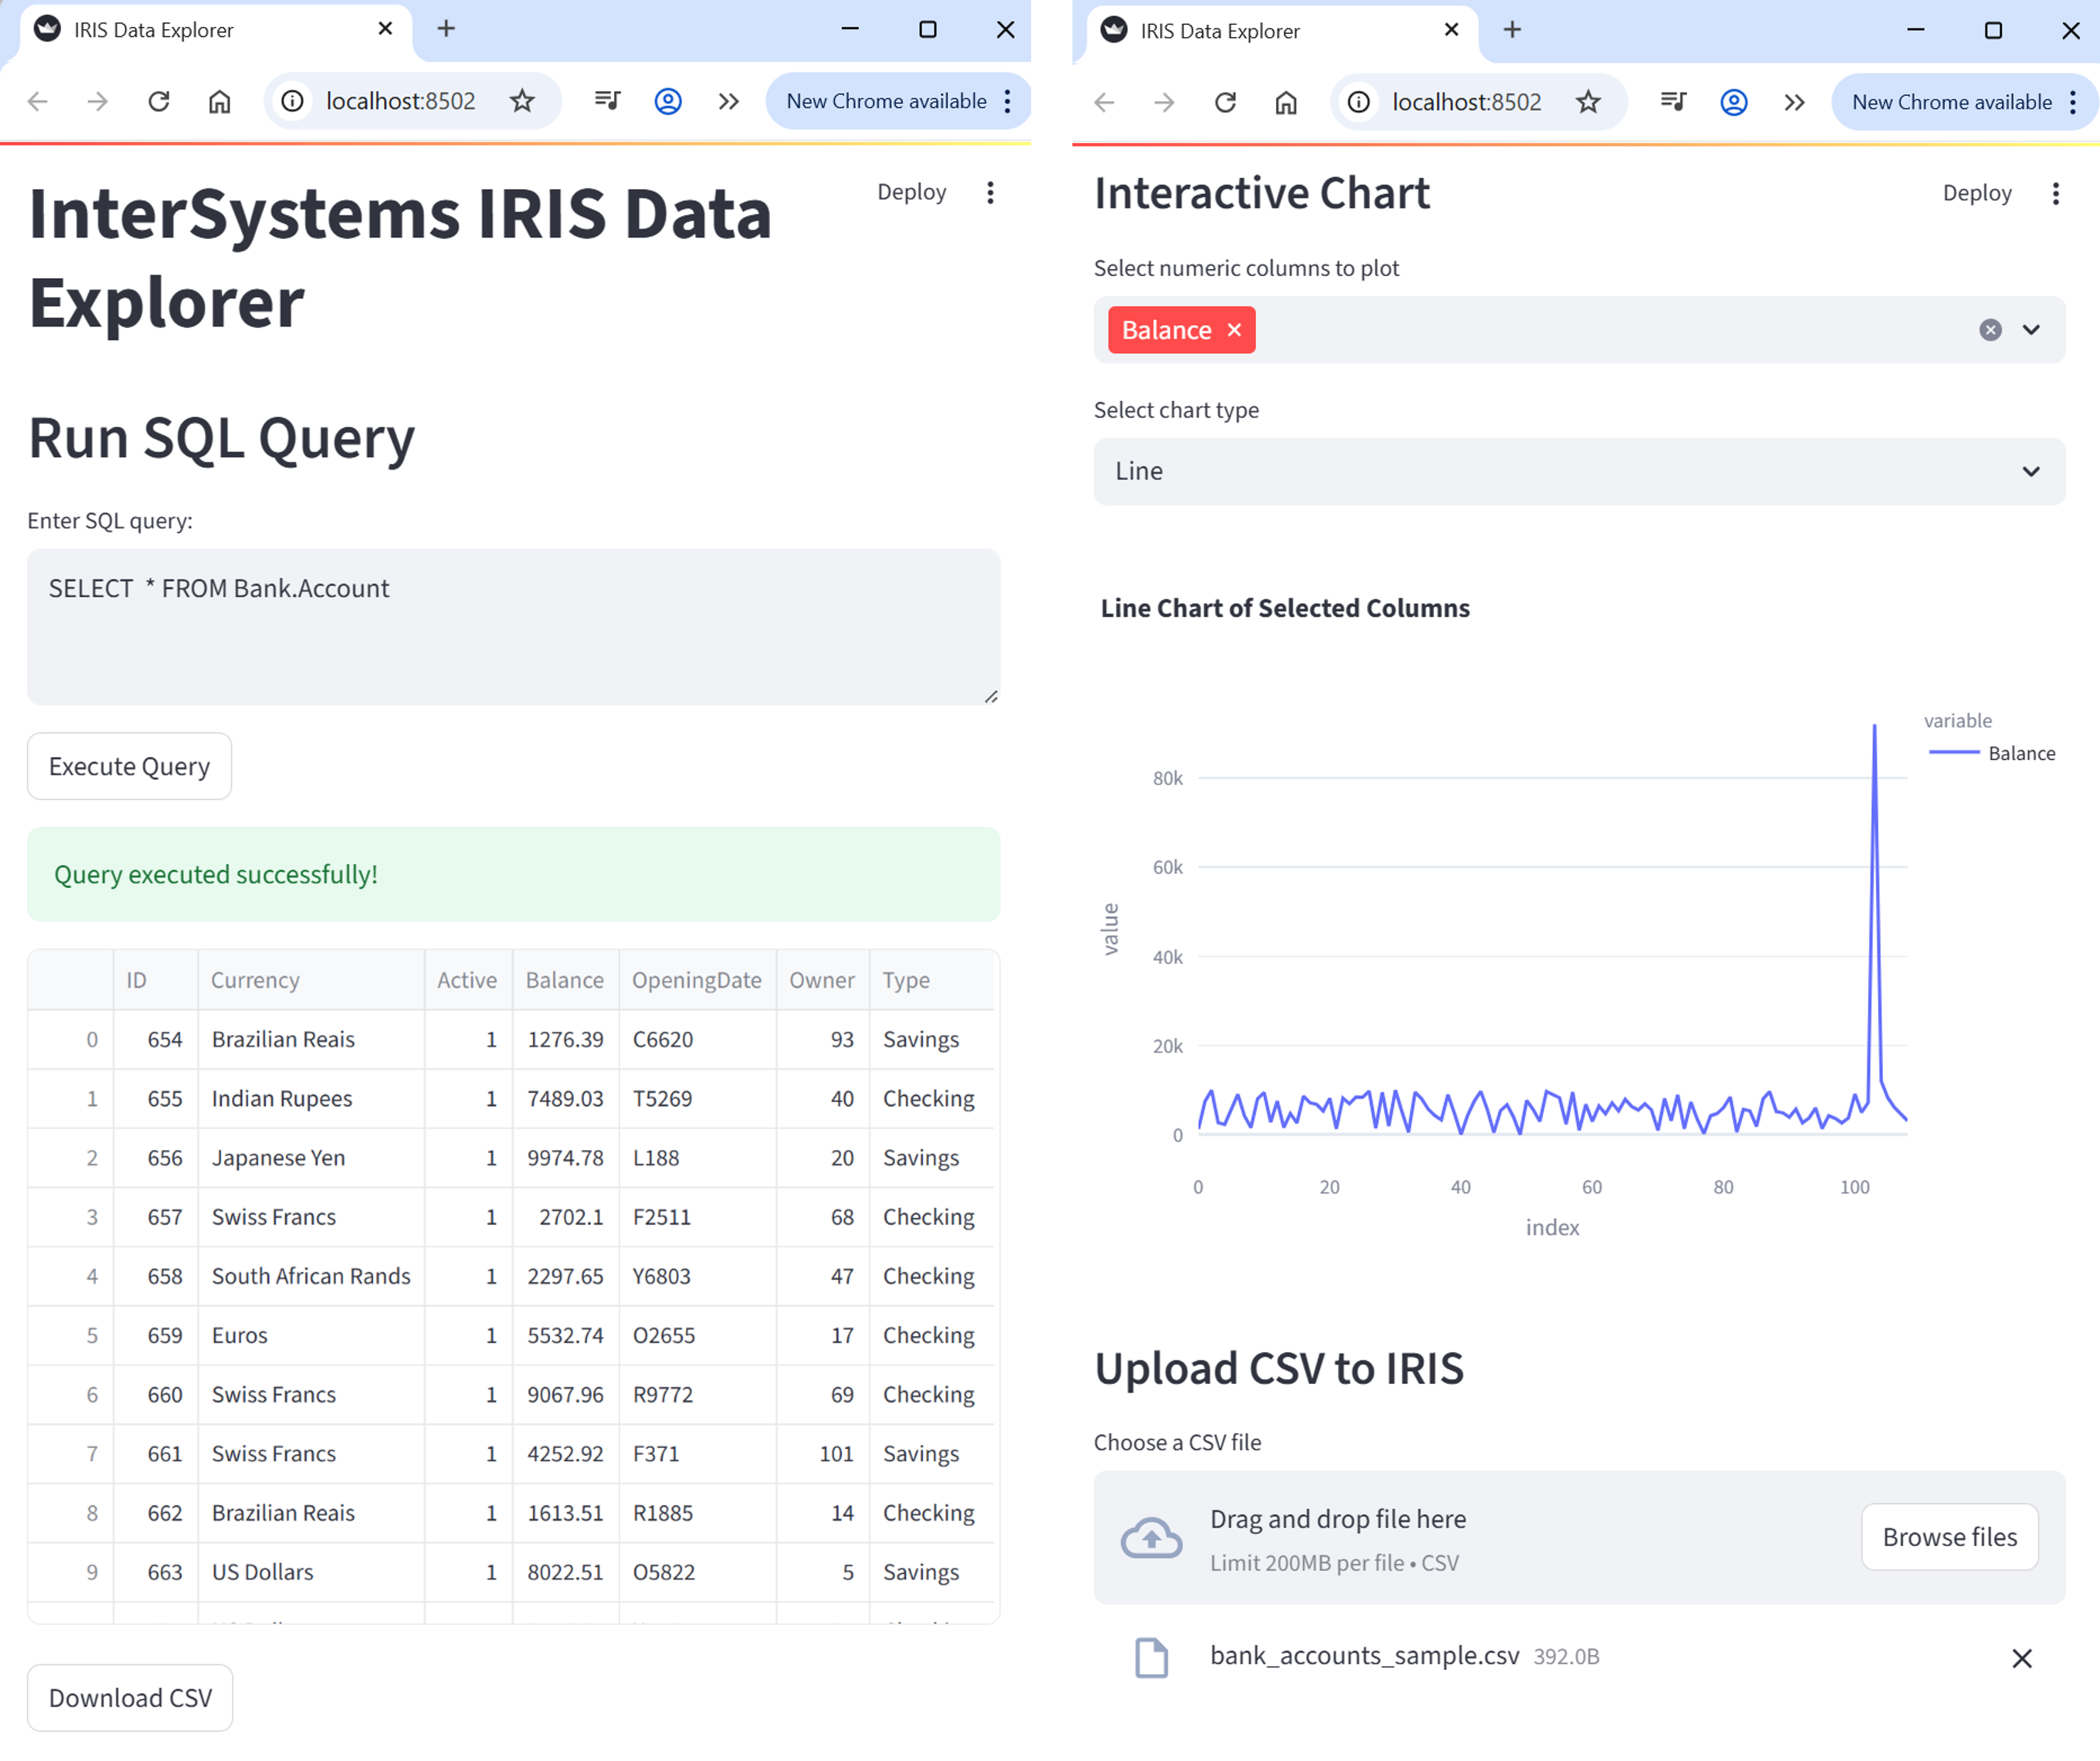
What You Build (at a Glance)
Here is what the final Streamlit app looks like:
Connecting to InterSystems IRIS
To connect to InterSystems IRIS using SQLAlchemy, define a connection string and create an engine. This engine object is reused throughout the app to run queries and insert data and acts like a persistent, reusable pipeline to your database.
from sqlalchemy import create_engine

# Replace with your credentials and connection information
username = "_SYSTEM"
password = "SYS"
namespace = "USER"
DATABASE_URL = f"iris://{username}:{password}@localhost:1972/{namespace}"

# Set echo=True to see the SQL queries being excuted in the command line
engine = create_engine(DATABASE_URL, echo=True)
For more documentation on using SQLAlchemy with InterSystems IRIS, see InterSystems IRIS and SQLAlchemy.
Configuring the Streamlit App Interface
Initialize the Streamlit app by setting the page configuration and title. This helps customize the app layout and metadata.
import streamlit as st

st.set_page_config(page_title="IRIS Data Explorer")
st.title("InterSystems IRIS Data Explorer")
set_page_config() allows you to customize the app’s layout and metadata.
Entering Queries
Give users a text box to enter SQL queries. You can provide an example query to help them get started.
st.header("Run SQL Query")

# Create a text area where users can enter their SQL query
# The second argument is the default query shown in the box
query = st.text_area("Enter SQL query:", "SELECT TOP 10 * FROM Sample.Person")
This lets users interactively explore any part of the database they have access to.
Executing SQL Queries
When users click the “Execute Query” button, they run the query against your InterSystems IRIS database using engine.connect() and store the result in memory using st.session_state. The engine.connect()creates a connection between Streamlit and your data using SQLAlchemy (see InterSystems IRIS and SQLAlchemy for more details on this connection). Understanding the underlying mechanism in engine.connect()is not necessary to complete this application. Just know that you need a way to communicate between Streamlit and InterSystems IRIS. Using engine.connect() accomplishes that.
# Create a button labeled "Execute Query"
# When clicked, the code inside the if-block runs
if st.button("Execute Query"):
    try:
        # Open a connection to the IRIS database using SQLAlchemy
        with engine.connect() as conn:
            # Use pandas to execute the SQL query and load the result into a DataFrame
            df = pd.read_sql(query, conn)

        st.success("Query executed successfully!")

        # Display the resulting DataFrame as an interactive table in the app
        st.dataframe(df)

        # Save df in session_state
        st.session_state['df'] = df

    except Exception as e:
        st.error(f"Error: {e}")
Streamlit reruns your script top-to-bottom on every user interaction. Using st.session_state helps you retain data like query results between runs. Without saving df into your session state, you run into errors saying that df is undefined.
Displaying Query Results in a Table
Show the query results in an interactive table.
if 'df' in st.session_state:
    df = st.session_state['df']

    # Display the table in your Streamlit app
    st.dataframe(df)
The dataframe command displays an interactive table of your data. It allows you to sort, filter, and scroll through the table, all within the browser.
Downloading Query Results as CSV Files
Let users export their results as a CSV file through a download button widget.
if 'df' in st.session_state:
    csv = st.session_state['df'].to_csv(index=False).encode("utf-8")

    st.download_button(
        label="Download CSV",
        data=csv,
        file_name="results.csv",
        mime="text/csv"
    )
In the example above:
-
index=False removes the DataFrame’s index column from the CSV file.
-
UTF-8 encoding ensures broad compatibility.
-
The MIME type tells the browser that this is a CSV file.
This is useful for offline analysis or sharing results with others.
Visualizing Data
Plotly ExpressOpens in a new tab is a powerful graphing library that integrates well with Streamlit for generating all sorts of charts. By feeding the data you have been extracting into Plotly, you can produce nice visualizations in web browser, all within Streamlit. Regardless of what library you use (matplotlib, ggplot2, seaborn, and so on), you can use InterSystems IRIS and Streamlit to add visualizations to your applications.
Retrieving and Validating Data
Before rendering any chart, we need to:
-
Check if query results (df) are available.
-
Extract only numeric columns (since visualizations depend on numerical data).
# Check if a DataFrame from a previous query exists
if 'df' in st.session_state:
    df = st.session_state['df']		# Get the stored DataFrame

    # Identify numeric columns for plotting
    numeric_cols = df.select_dtypes(include='number').columns.tolist()

    # Warn the user if there is nothing numeric to chart
    if df.empty or not numeric_cols:
        st.info("No numeric data available for visualization.")
Use select_dtypes(include='number') to filter numeric columns, which are required for charts like line, bar, and scatter plots.
User Input—Column and Chart Type Selection
Once numeric data is available, the user can:
-
Choose which numeric columns to plot.
-
Choose the type of chart they want to render.
	else:
		st.subheader("Interactive Chart")

		# Multiselect input to choose numeric columns to plot
		cols = st.multiselect(
			"Select numeric columns to plot",
			options=numeric_cols,
			default=[numeric_cols[0]]		# Preselect the first numeric column
		)

		# Dropdown menu to select the chart type
		chart_type = st.selectbox(
			"Select chart type",
			["Line", "Bar", "Area", "Scatter"]
		)
Use st.multiselect() to let users plot multiple columns at once. For scatter plots, ensure they choose exactly 2 columns.
The else statement comes from the fact that we first checked that there is some numeric data to chart from above.
Generating Chart
Based on the user’s input, we create the appropriate chart using Plotly Express.
import plotly.express as px

# Only proceed if columns are selected
if cols:
    fig = None

    if chart_type == "Line":
        fig = px.line(df, y=cols, title="Line Chart of Selected Columns")

    elif chart_type == "Bar":
        fig = px.bar(df, y=cols, title="Bar Chart of Selected Columns")

    elif chart_type == "Area":
        fig = px.area(df, y=cols, title="Area Chart of Selected Columns")

    elif chart_type == "Scatter":
        if len(cols) >= 2:
            fig = px.scatter(
                df,
                x=cols[0],		# First selected column as x-axis
                y=cols[1],		# Second selected column as y-axis
                title=f"Scatter Plot: {cols[0]} vs {cols[1]}"
            )
        else:
            st.warning("Select at least 2 columns for Scatter plot")
Rendering Chart
Finally, if a figure was successfully created, we render it in the Streamlit app.
# Render the Plotly figure inside the streamlit app
if fig:
    st.plotly_chart(fig, use_containter_width=True)
Uploading CSV Data into InterSystems IRIS
Users can upload a CSV file through a Streamlit app and insert its contents into a pre-existing InterSystems IRIS table using SQLAlchemy.
Uploading a CSV
Give users the option to upload a CSV in the Streamlit app.
st.subheader("Uplaod CSV to IRIS")
uploaded_file = st.file_loader("Choose a CSV file", type="csv")
-
st.file_uploader allows users to upload files through the user interface.
-
The file type is restricted to .csv to ensure format consistency.
Previewing the Data
Once the file is uploaded, use pandas to read it and show a preview of it.
if uploaded_file:
    csv_df = pd.read_csv(uploaded_file)
    st.dataframe(csv_df.head())
-
pandas.read_csv() parses the file.
-
The first few rows of the uploaded file are displayed with .dataframe() for review before insertion.
Entering Target Table Name
Ask the user to enter the InterSystems IRIS table name (for example, Sample.Person).
# Input: full table name in format "Namespace.Table"
full_table_name = st.text_input("Enter target IRIS table (e.g., Bank.Account)")
-
Users enter the full InterSystems table name, optionally including the namespace (for example, Bank.Account).
-
If a dot (.) is present, it is interpreted as schema.table.
Inserting Data into InterSystems IRIS
Now insert the DataFrame into the specified table.
if st.button("Insert Data"):
    try:
        # Split schema (namespace) and table name if dot notation is used
        if '.' in full_table_name:
            schema, table_name = full_table_name.split('.', 1)
        else:
            schema = None
            table_name = full_table_name

        # Attempt to insert the data into an existing table
        with engine.begin() as conn:
            csv_df.to_sql(
                name=table_name,
                con=conn,
                if_exists='append',
                index=False,
                schema=schema,
                method='multi'		# Batch insert to InterSystems IRIS
            )

        st.success(f"Successfully inserted data into {full_table_name}")

    except Exception as e:
        st.error(f"Insertion failed: {e}")
-
The input is parsed to separate the schema (namespace) and table name.
-
If no namespace is provided, schema=None is passed, and InterSystems IRIS uses the default namespace.
-
engine.begin() ensures that the operation runs within a transaction context.
-
In to_sql():
-
name is the table name.
-
schema is the InterSystems IRIS namespace (optional).
-
if_exists='append' prevents a table override.
-
method='multi' improves the performance by batching inserts.
-
The target table must already exist in InterSystems IRIS. This method does not create new tables.
If your table includes an auto-generated ID column, you must not try to insert into it directly unless explicitly allowed. To avoid RowID conflicts (for example, auto-generated ID columns), drop before ID inserting.
if "ID" in csv_df.columns:
    st.warning("Dropping 'ID' column to let IRIS auto-generate it.")
    csv_df = csv_df.drop(columns=["ID"])
Running Your Application
Once you have finished building your Streamlit app, running it locally is quick and easy.
Save your complete code in a file (for example, app.py), and then your Streamlit app from the command line:
streamlit run app.py
If the streamlit is not recognized, you can also run it as a Python module:
python -m streamlit app.py
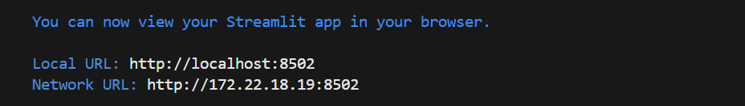
Your browser should automatically open the app. The command lines display logs, status updates, and the URL to access your app manually. You can now interact with your app live, whether you are running queries, uploading files, or visualizing data.
When you make changes to your app.py file:
-
Simply save the file, and Streamlit detects any changes.
-
By default, the Streamlit app prompts you to rerun it. Click “Always rerun” (in the top-right corner of the browser) for a smoother workflow.
Visit the official StreamlitOpens in a new tab, pandasOpens in a new tab, and PlotlyOpens in a new tab documentation to explore more available capabilities.
Complete Streamlit Code
The following is the entire code for the built Streamlit application.
# Initializing Streamlit app
import streamlit as st

import pandas as pd

# Import Plotly Express for interactive charting
import plotly.express as px

# SQLAlchemy Connection to InterSystems IRIS
from sqlalchemy import create_engine

# Connect to IRIS
username = "_SYSTEM"
password = "SYS"
namespace = "USER"
DATABASE_URL = f"iris://{username}:{password}@localhost:1972/{namespace}"

engine = create_engine(DATABASE_URL, echo=True)

st.set_page_config(page_title="IRIS Data Explorer")
st.title("InterSystems IRIS Data Explorer")

st.header("Run SQL Query")

# Create a text area where users can enter their SQL query
# The second argument is the default query shown in the box
query = st.text_area("Enter SQL query:", "SELECT TOP 10 * FROM Sample.Person")

# Create a button labeled "Execute Query"
# When clicked, the code inside the if-block runs
if st.button("Execute Query"):
    try:
        # Open a connection to the IRIS database using SQLAlchemy
        with engine.connect() as conn:
            # Use pandas to execute the SQL query and load the result into a DataFrame
            df = pd.read_sql(query, conn)

        st.success("Query executed successfully!")

        # Display the resulting DataFrame as an interactive table in the app
        st.dataframe(df)

        # Save df in session_state
        st.session_state['df'] = df

    except Exception as e:
        st.error(f"Error: {e}")

if 'df' in st.session_state:
    csv = st.session_state['df'].to_csv(index=False).encode("utf-8")

    st.download_button(
        label="Download CSV",
        data=csv,
        file_name="results.csv",
        mime="text/csv"
    )

# Check if a DataFrame from previous query exists
if 'df' in st.session_state:
    df = st.session_state['df']  # Get the stored DataFrame

    # Identify numeric columns for plotting
    numeric_cols = df.select_dtypes(include='number').columns.tolist()

    # Warn the user if there's nothing numeric to chart
    if df.empty or not numeric_cols:
        st.info("No numeric data available for visualization.")

# Check if df is stored in session_state and visualize
if 'df' in st.session_state:
    df = st.session_state['df']

# Check if the query results DataFrame ('df') exists in Streamlit's session_state
if 'df' in st.session_state:
    df = st.session_state['df']  # Retrieve the DataFrame from session state

    # Extract only numeric columns from the DataFrame for plotting
    numeric_cols = df.select_dtypes(include='number').columns.tolist()

    # If no data is available or there are no numeric columns, notify the user
    if df.empty or not numeric_cols:
        st.info("No numeric data available for visualization.")
    else:
        # Display a subheader for the chart section
        st.subheader("Interactive Chart")

        # Allow users to select one or more numeric columns to plot
        # The default is the first numeric column
        cols = st.multiselect(
            "Select numeric columns to plot",
            options=numeric_cols,
            default=[numeric_cols[0]]
        )

        # Let users choose the type of chart to generate
        chart_type = st.selectbox(
            "Select chart type",
            ["Line", "Bar", "Area", "Scatter"]
        )

        # Only proceed if at least one column is selected
        if cols:
            fig = None  # Initialize the figure object

            # Generate the appropriate chart based on the selected type
            if chart_type == "Line":
                # Plot a line chart with the selected columns on the y-axis
                fig = px.line(df, y=cols, title="Line Chart of Selected Columns")

            elif chart_type == "Bar":
                # Plot a bar chart with the selected columns on the y-axis
                fig = px.bar(df, y=cols, title="Bar Chart of Selected Columns")

            elif chart_type == "Area":
                # Plot an area chart with the selected columns on the y-axis
                fig = px.area(df, y=cols, title="Area Chart of Selected Columns")

            elif chart_type == "Scatter":
                # Scatter plot requires at least 2 numeric columns
                if len(cols) >= 2:
                    # Use first column as x-axis and second as y-axis
                    fig = px.scatter(
                        df,
                        x=cols[0],
                        y=cols[1],
                        title=f"Scatter Plot: {cols[0]} vs {cols[1]}"
                    )
                else:
                    st.warning("Select at least 2 columns for Scatter plot")

            # If a valid figure was created, display it using Streamlit
            if fig:
                st.plotly_chart(fig, use_container_width=True)
                # use_container_width=True makes the chart responsive to app layout

st.subheader("Upload CSV to IRIS")

# File uploader for CSV files
uploaded_file = st.file_uploader("Choose a CSV file", type="csv")

if uploaded_file:
    # Read and preview the uploaded CSV
    csv_df = pd.read_csv(uploaded_file)
    st.dataframe(csv_df.head())

    # Input: full table name in format "Namespace.Table"
    full_table_name = st.text_input("Enter target IRIS table (e.g. Bank.Account)")

    if st.button("Insert Data"):
        try:
            # Split schema (namespace) and table name if dot notation is used
            if '.' in full_table_name:
                schema, table_name = full_table_name.split('.', 1)
            else:
                schema = None
                table_name = full_table_name

            # Attempt to insert data into existing table
            with engine.begin() as conn:
                csv_df.to_sql(
                    name=table_name,
                    con=conn,
                    if_exists='append',
                    index=False,
                    schema=schema,
                    method='multi'  # batch insert for IRIS
                )

            st.success(f"Successfully inserted data into '{full_table_name}'")

        except Exception as e:
            st.error(f"Insertion failed: {e}")