
Monitoring a Production
This topic describes how to monitor a single production (in contrast to when you use the Production System Monitor, which monitors all namespaces).
General Notes
For background information, see Concepts.
For information on starting and stopping productions, see Managing Productions. Note that for a live, live, deployed production, InterSystems recommends that you use the auto-start option.
If a production is Suspended or Troubled, see Correcting Production Problem States.
Using the Production Monitor Page
The Interoperability > Monitor > Production Monitor page displays real-time status information about the currently running production in a condensed, one-page format, with links for further details. To display this page in the Management Portal, select Interoperability, Monitor, Production Monitor, and Go.
You can use this page to monitor the general health of the production in the selected namespace. The following is a partial example of what this page displays:
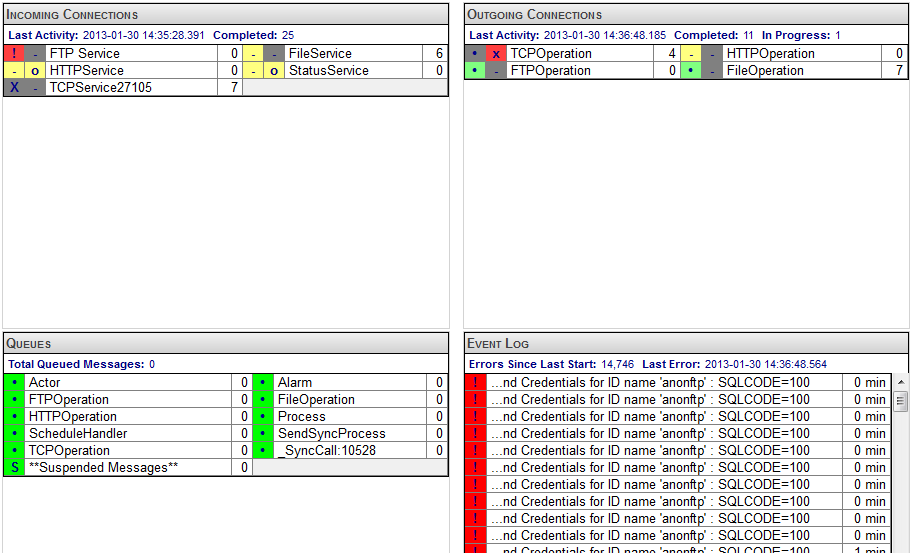
The Production Monitor page displays real-time information provided by the Monitor Service. The Monitor Service is a business service that is implicitly included in every production (not visible as part of its configuration). The Monitor Service continually monitors the activities of items while a production is running, and records data about them at frequent intervals.
Input Connections
The Incoming Connections table lists all incoming connections from external systems. The Completed field indicates how many messages have been processed by the production’s business services, including internal services like Ens.ScheduleService. Each entry in the table indicates the following:
-
Business service status
-
Business service connection status
-
Business service name
-
Number of messages processed since the production started
The statuses are indicated by the cell color. The item status and the connection status cells have the following meaning:
-
Business Service status (first cell).
-
Green • (dot)—Active and OK.
-
Yellow - (hyphen)—Currently inactive, but otherwise OK.
-
Red ! (exclamation mark)—Error.
-
Gray X (letter X)—Disabled.
-
-
Connection status (second cell). The connection status is meaningful for TCP, HTTP, FTP, and ODBC connections.
-
Green + (plus sign)—Connected.
-
Yellow o (letter o)—Listening.
-
Red x (letter x)—Disconnected.
-
Gray - (hyphen)—Not applicable, disabled, unscheduled, or not connecting.
-
If you hover over the name of the service, the hover text provides additional information. If you select on the name of the service, the right area is updated with details and also displays the following associated links:
-
Event Log—Click to view the Event Log entries for the selected configuration item. For information, see Viewing the Event Log.
-
Queue Contents—Click to view the production queues. For information, see Monitoring Production Queues.
Output Connections
The Outgoing Connections table lists all outgoing connections to external systems. The Completed field indicates how many messages have been processed by the production’s business operations, including internal operations like Ens.Alarm. Each entry indicates the following:
-
Business operation status
-
Business operation connection status
-
Business operation name
-
Number of messages processed since the production started
The statuses are indicated by the cell color. The item status and the connection status cells have the following meaning:
-
Business Operation status (first cell).
-
Green • (dot)—Active and OK.
-
Yellow - (hyphen)—Currently inactive, but otherwise OK.
-
Red ! (exclamation mark)—Error.
-
Gray X (letter X)—Disabled.
-
Gray • (dot)—Retry. The business operation connection failed and the operation is retrying the connection.
-
-
Connection status (second cell). The connection status is meaningful for TCP, HTTP, FTP, and ODBC connections.
-
Green + (plus sign)—Connected.
-
Yellow o (letter o)—Listening.
-
Red x (letter x)—Disconnected.
-
Gray - (hyphen)—Not applicable, disabled, unscheduled, or not connecting.
-
If you select the name of the operation, the right area is updated with details and the same links as for the Incoming Connections table.
Queues
The Queues table lists the status of InterSystems IRIS® internal message queues and how many messages are currently waiting in each queue.
This table uses the same icons and color-coding as the Incoming Connections table. If you click an item in this table, the right area is updated with details and the Queue Contents link.
Event Log
The Event Log summarizes recent entries in the Event Log.
Each entry provides an icon and color to indicate the item’s status, as follows:
-
Red !—Error.
-
Orange W—Warning.
-
Yellow A—Alert.
Note that the session ID indicates only the most recent session at the time of the alert. This session may or may not be associated with the cause of the alert.
If you select an item in this table, the right area is updated to show details of that Event Log entry. It also displays the Event Log link, which you can use to see the entire Event Log.
Activity Graph
The activity graph shows the message activity for the production or for a selected incoming or outgoing connection. The graph can show the message activity over a time period ranging from the previous 7 days to the previous 5 minutes. The following displays the activity graph or history of the production monitor:
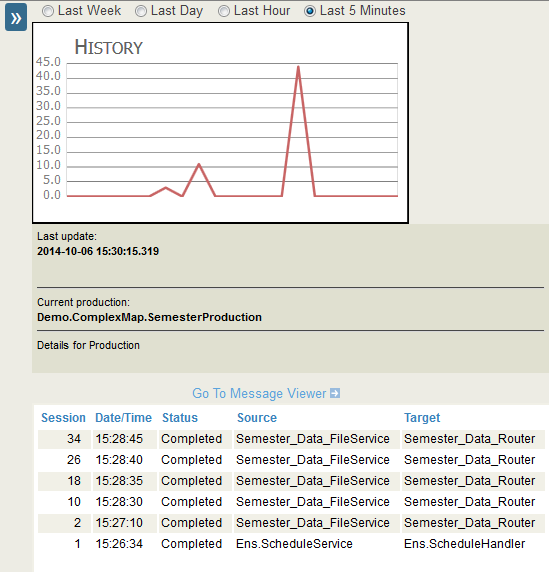
You can specify the following for the activity graph:
-
Component to monitor—when you start the Production Monitor, the Activity Graph shows the messages for all incoming and outgoing connections. If you select an incoming or an outgoing connect on the Production Monitor, the Activity Graph shows the activity for the selected component only. If you want to return to the activity of the entire production, select on the currently selected connection to deselect it.
-
Auto update—if this check box is selected, the Production Monitor regularly updates the Activity Graph.
-
Time period to display—select one of the following:
-
Last week—display the activity for the previous 7 days. The vertical axis specifies the number of messages per hour.
-
Last day—display the activity for the previous 24 hours. The vertical axis specifies the number of messages per 15-minute interval.
-
Last hour—display the activity for the previous 60 minutes. The vertical axis specifies the number of messages per minute.
-
Last 5 minutes—display the activity for the previous 5 minutes. The vertical axis specifies the number of messages per 15-second interval.
-
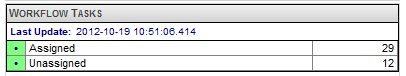
Custom Metrics
The bottom area of the page might display one or more tables of custom metrics added by your InterSystems IRIS® developers. For example:
Using the Production Monitor Service
While a production is running, InterSystems IRIS may detect discrepancies between the status of the production and its definition in the code. For example, the system may detect that a business host has experienced an error and died. When this happens, the Update button appears on the Production Configuration page and enables you to manually resolve the discrepancy.
If you prefer to take action programmatically when a production is out-of-date, you can use the Ens.ProductionMonitorServiceOpens in a new tab class. Specifically, you can add a business service based on the Ens.ProductionMonitorServiceOpens in a new tab class to your production as described in Adding Business Hosts to a Production. By default, this business service checks the status of the production every five seconds. If the production is out-of-date, the business service calls the UpdateProduction() method of the Ens.DirectorOpens in a new tab class. You can change the interval at which the business service checks the production by modifying its Call Interval value. You can also customize the behavior of the business service when it detects that a production is out-of-date by modifying its OnProcessInput() method.
Monitoring Production Queues
The Interoperability > Monitor > Queues page shows the current state of all the message queues being used by the running production in the selected namespace.
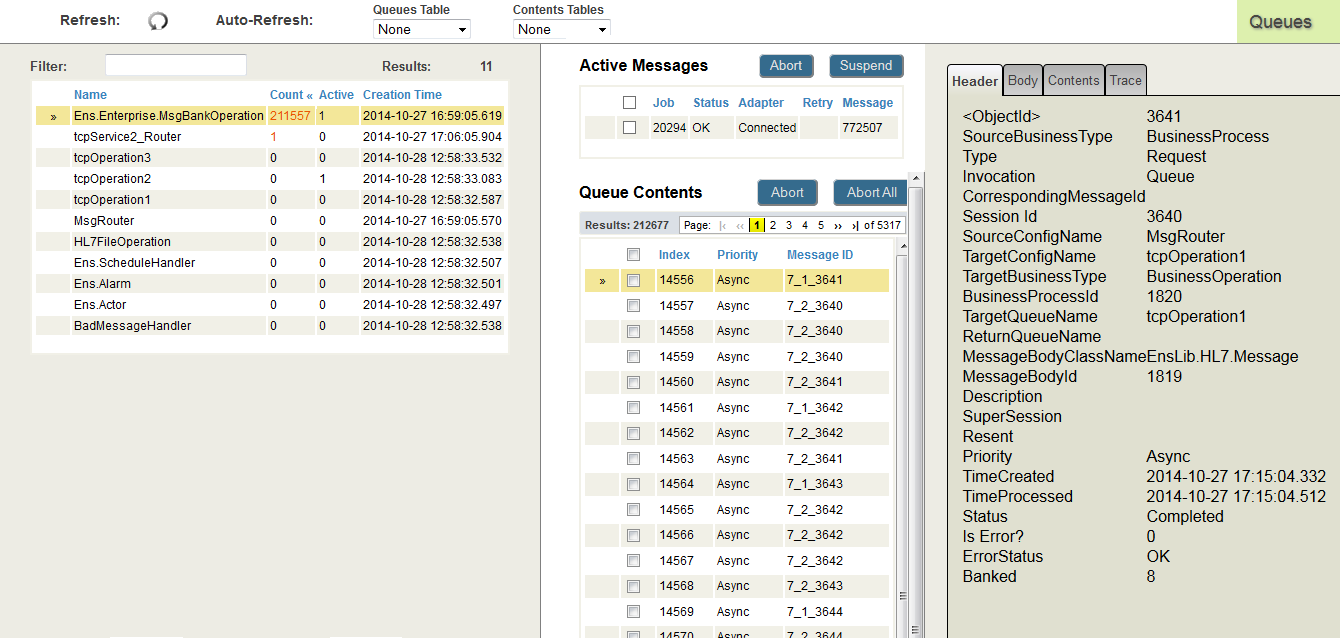
The table on this page has one row for each queue. The columns in this table are as follows:
-
Name—The name of the configuration item that has the queue. It may be different from the host class name.
Note:The _SyncCall:<process id> queue is not named after a configuration item. It is a temporary queue created to receive the response from a synchronous request.
-
Count—How many messages are on the queue. This value is a snapshot and may change when you refresh the page.
-
Active—The number of active messages.
-
Creation Time—The date and time when the queue was first created.
To see the contents of any given queue, select the row for that queue. The active messages and queue contents for that queue are displayed. If you select an entry in the queue contents or active messages, information about the message is displayed.
You can refresh the list of queues and contents by clicking the refresh arrow.
The Active Messages table is displayed when there are active messages in the selected queue. It has one row for each active message, which identifies the message and its state. If you select one or more messages by checking the check box, you can abort or select the selected messages.
In the Active Messages table, you can select a message row to view the details of the selected message. The details are displayed to the right in the Header, Body, Contents, and Trace tabs. These tabs are the same as in the Message Viewer page; see Viewing Messages.
The Queue Contents table on this page is displayed if there are messages in the selected queue. It has one row for each message in the given queue. The columns in this table are as follows:
-
Index—This integer value starts at 1 for the first message placed on the queue after the production starts, and increments by 1 for each successive message. A message has the same Index value for the entire time it is on the queue. Index values are never reused.
-
Priority—The priority of the message. See Message Priority.
-
MessageId—The object identifier for the message.
In the Queue Content table, you can perform the following tasks:
-
Select a message row to view the details of the selected message. The details are displayed to the right in the Header, Body, Contents, and Trace tabs. These tabs are the same as in the Interoperability > View > Messages page; see Viewing Messages.
-
Select messages by checking the check box for the messages.
-
Click Abort to abandon any ongoing attempts to send one or more messages selected with the check box. Click OK to verify the operation.
-
Click Abort All to abandon ongoing attempts to send all the messages in the queue. You must then click OK to verify the operation.
Note:In order to use Abort or Abort All, you must have the WRITE permission on the %Ens_Queues resource.
-
Select a page number to view that page in the list. Selecting |< displays the first page, << displays the previous page, >> displays the next page, and >| displays the last page.
Diagnosing Problems with Queues
By looking at queues and jobs, you can often quickly spot a problem in the system.
When there is buildup on a queue, it usually means something needs to be repaired. Usually the most important information about queues is the destination, or “target,” of any message that has been too long on a queue. In general, when a queued message is not being sent, it is because it cannot get to its target. If you can find out what is causing a problem with the target, when you solve that problem, the queue buildup will generally disappear. For example:
-
For a business service or business operation, if a queue is suddenly longer, this generally means that there is a problem communicating with an external system. An external connection may be down, or there may be a peak-hour effect that is affecting throughput on your external connections.
-
For a business service or business operation, if a queue is consistently long, this generally means that there is a consistent delay in sending messages. You should probably examine the external connection to see if there a performance problem that you can solve. If that is not possible, you could increase the appropriate pool size (unless you need to ensure first-in-first-out processing).
-
For a business process that uses a private pool, if a queue is consistently long, you could increase the appropriate pool size (unless you need to ensure first-in-first-out processing).
-
If the actor queue is suddenly longer, a business process may have experienced an error that has caused it to become “stuck” in some way.
-
If the actor queue is consistently long, the actor pool for the production may need to be larger.
-
If many queues have a consistently large buildup, there may be a general capacity issue on the host computer, the production (in its role as a CSP application) may need more resources, or the underlying InterSystems IRIS installation may need to be tuned. For suggestions, see the System Administration Guide. In general, however, you will be able to keep queues moving with the simpler adjustments listed in this topic.
Monitoring Active Jobs
The Interoperability > Monitor > Jobs page shows the currently active jobs for the production in the selected namespace.
The table on this page has one row for each active job. The columns in this table are as follows:
-
Job—Internal numeric identifier of the job.
-
Configuration Name—Configuration name of the business host for which this job was started.
Each time a business service, business process, or business operation needs to do work, it starts a system job in which to complete its tasks. This job comes either from a private pool of jobs belonging to the business service, business process, or business operation, or (in the case of a business operation) it may come from the public actor pool for the production. When the task is done, the job returns itself to the pool of jobs from which it came.
A production might need to start and stop several different jobs to complete a single request. The details depend (in part) on whether requests are made synchronously or asynchronously. For example, if a job is required to wait, the job returns itself to its pool during the wait time to free up that resource.
-
Mode—Either Background or Foreground.
-
Status—Typically, this is running or dequeuing.
-
Detail—Any additional detail that is available for the job.
-
Active Message—ID of the message currently being processed, if any.
-
State—Typically, this is active.
Diagnosing Problems with Jobs
By looking at jobs and queues, you can often quickly spot a problem in the system.
Most jobs spend most of their time in a dequeuing state while they wait for messages. During shutdown they should become quiescent. If the job does not become quiescent during shutdown, that likely indicates a problem. If the job is constantly in a running state, that also indicates a problem, unless you expect the component to be doing a lot of processing (and it is actually completing this processing).
Jobs that are marked as dead are jobs that have been terminated for some reason and InterSystems IRIS has detected that the job is no longer present on the system. This is normally an indication of a serious problem and should not occur. Also, if InterSystems IRIS detects a dead job, it writes an error to the Event Log.
Aborting Messages, Suspending Messages, and Stopping Jobs
The Management Portal enables you to perform the following tasks in order to manage or troubleshoot active jobs:
-
Abort the message that a job is currently attempting to resend. You can then view the message in the Message Viewer. For more information, see Browsing the Messages.
-
Suspend the message that a job is currently attempting to resend. Suspended messages are routed to a special queue, which you can view in the Suspended Messages page. For more information, see Managing Suspended Messages.
-
Stop a job altogether.
You must have WRITE permission on the %Ens_Jobs resource to stop a job or request that it abort a message. You must have USE permission on the %Ens_MessageSuspend resource to request that a job suspend a message.
To take action on an active job, do the following:
-
Navigate to Currently Active Jobs page or to the Jobs tab in the Production Configuration page that includes the job of interest.
Note:The Jobs tab lists only the latest 100 jobs.
-
Select the job of interest.
-
Click Abort, Suspend, or Stop as appropriate.
Using the Production Configuration Page
InterSystems IRIS provides another way to view a production, the Interoperability > Configure > Production page.
This page displays the business hosts in the production, with useful color coding as in the following example:
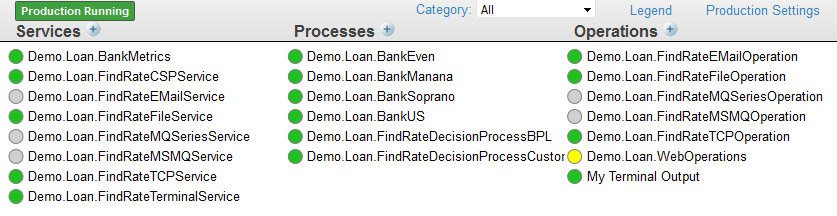
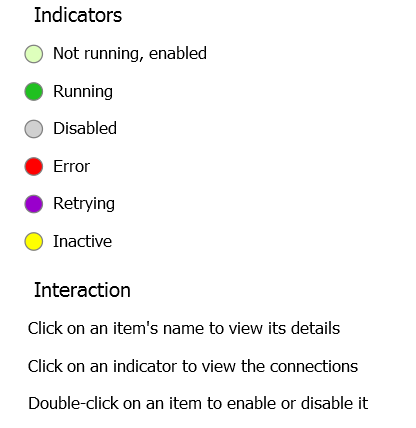
This page displays a circular status indicator next to each business host. If you click Legend to see the meaning of this indicator, InterSystems IRIS displays the following:
Note that the primary purpose of this page is for configuring productions as described in Configuring Productions.
Correcting Production Problem States
If a production is Suspended or Troubled, read this section.
If the state of a production is Running, then a production has been started and is operating normally. This is an acceptable state.
If the state of a production is Stopped, it is not running and all of its queues are free of synchronous messages. This is also an acceptable state.
In some cases (usually during development), you might see the Update button on this page for a production that is Running. Click this, and InterSystems IRIS updates the production to resolve the discrepancy.
Recovering a Suspended Production
A production acquires the Suspended status when, at the end of the shutdown sequence, some queues still contain synchronous messages.
You can start the Suspended production again to permit these messages to be processed. However, if the underlying problem is not resolved, you might acquire more synchronous messages in the queue without processing the previous messages.
Therefore, if a live, deployed production goes into a Suspended state, contact the InterSystems Worldwide Response CenterOpens in a new tab (WRC) for assistance.
If a production becomes Suspended during development, see Correcting Production Problem States. In this case, you can use a procedure that discards the messages.
Recovering a Troubled Production
A production acquires a status of Troubled if InterSystems IRIS is stopped but the production did not shut down properly. This can happen if you restarted InterSystems IRIS or rebooted the machine without first stopping the production. In this case, click the Recover button.