
Introduction to the User Portal
This page introduces the InterSystems IRIS® data platform User Portal, which is meant for end users of InterSystems IRIS Business Intelligence.
Be sure to consult InterSystems Supported Platforms for information on system requirements.
Purpose of the User Portal
The User Portal is intended for direct use by end users and is designed to enable you to do the following tasks:
-
View and use dashboards and pivot tables, all containing key information. This information can include production business metrics. For Business Intelligence users, this information presents aggregated views of your data that you can investigate in various ways.
You can organize these items into folders for easier management. Also, you can attach keywords to these items, so that you can find items again more quickly.
-
Share your dashboards and pivot tables with other users.
The User Portal is a shared environment. That is, the same items are visible to all users who have access to the User Portal for a given namespace.
-
Create dashboards, which generally display pivot tables and other elements such as meters and scorecards. Dashboards are typically intended to address specific business needs.
-
Access the Analyzer, in which you can create pivot tables or perform ad hoc analysis of data.
-
Share and access links to web pages.
-
Manage your workflow tasks.
Logging On to Business Intelligence
In a supported browser, go to the following URL, using the <baseURL> for your instance:
http://<baseURL>/csp/samples/_DeepSee.UserPortal.Home.zen
Where samples is the namespace that you are using. When prompted, enter your InterSystems IRIS username and password.
Selecting a Preferred Language
This user interface can be displayed in different languages. Initially, the default preferred language (that is, the session language) is the language specified for the browser, or English if the browser language is not supported.
To select your preferred language, select About and then select an option in the list Preferred language for this session.
Note that after you select a language here, the system continues to use that language even if you change the language used by the browser.
Introduction to the User Portal
The following shows an example of the User Portal:
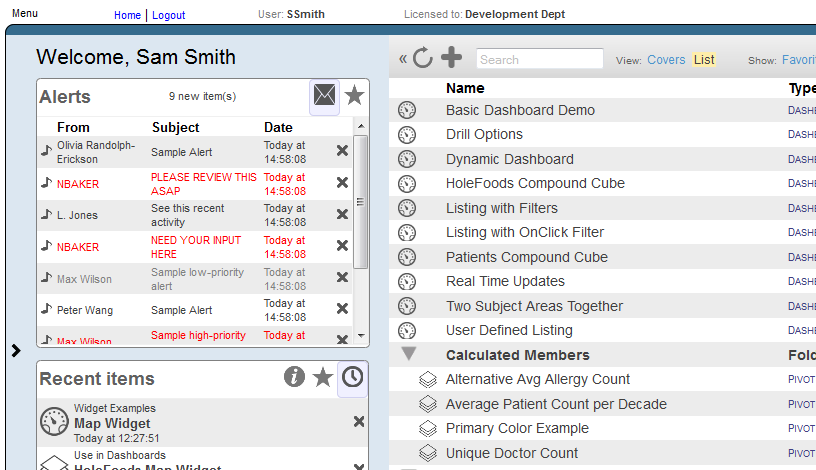
Notice the following elements in this page:
-
The left area contains worklists, which are rectangular areas that contain tools. For details, see Using Worklists in the User Portal.
-
The main area on the right shows the public Business Intelligence pivot tables, dashboards, and other items.
Here you can open items, delete items, and mark items as favorites. You can also expand or collapse the folders. The top area provides a search option.
For a dashboard, this area displays the title of the dashboard, if it has a title; otherwise, this area displays the name of the dashboard.
This area does not display items that are marked as private.
For workflow users, the main area also displays an item labeled Workflow Inbox.
-
The Menu link in the upper left contains options to create and open dashboards and pivot tables and perform other tasks in Business Intelligence.
If you are assigned to the %Developer role, this menu includes an option to access the Management Portal.
-
The Home link at the top displays this page.
-
The Logout link enables you to log out.
The User Portal is a shared environment. Many of the items you see are also visible to other users.
About Pivot Tables and Dashboards
Pivot tables are central to Business Intelligence; they select and aggregate data. The following figure shows an example pivot table that shows the number of patients and the average allergy count per patient, grouped by age and gender.
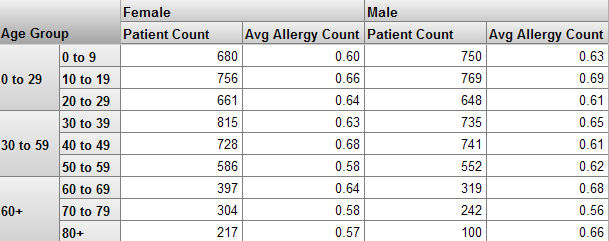
Using this example as a reference, let us discuss the key terms in Business Intelligence:
-
A level is used to group the source data. A level has members. Each member, in turn, corresponds to a specific set of records in the source data.
For example, the Age Group level has the members 0-29, 30-39, and 60+. The Gender level has the members Female and Male.
-
A measure is a value displayed in the body of the pivot table; it is based on values in the source data. For a given context, a measure aggregates the values for all applicable source records and represents them with a single value.
For example, the measure Patient Count is the number of patients, and the measure Avg Allergy Count is the average number of allergies per patient.
The preceding example shows a preview of a pivot table within the Analyzer, which provides a large set of tools for modifying the pivot table, exporting to Microsoft Excel, toggling to a chart format, and so on.
You typically see a pivot table within a dashboard, as follows:
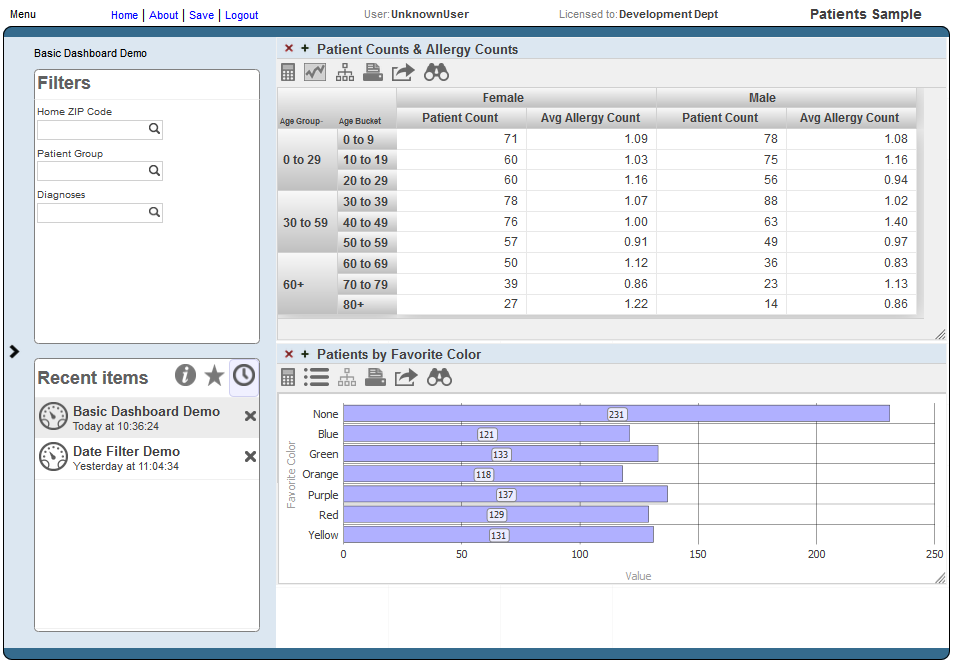
Notice that this dashboard includes multiple filters (shown in the Filters box), which you can use to filter the items on this dashboard.
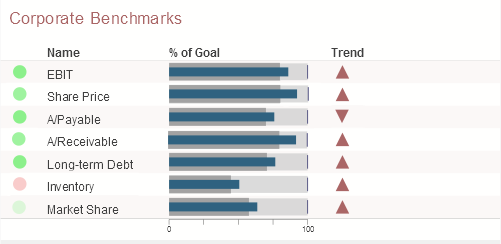
Dashboards can include other kinds of elements, including meters and scorecards. A scorecard shows multiple rows of data in a tabular format that also includes features such as value-dependent lamps and arrows. For example:
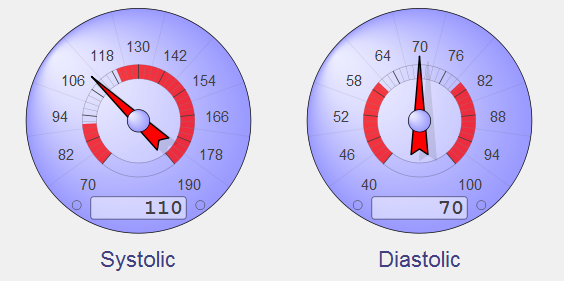
A meter shows one or more values in graphical objects like the following:
For more information on dashboards, see Using Dashboards.
Summary of Options in the User Portal
In the User Portal, you can do the following tasks, depending upon your permissions:
-
Send alerts to other users.
Note:These alerts are unrelated to production alerts.
-
Review alerts that you have received.
-
Send email to other users (if your system is configured for this).
-
Manage workflow tasks.
-
Mark items as favorites, for easy access.
-
Create, modify, view, and work with dashboards.
For information on creating and modifying dashboards, see Creating Dashboards.
-
Create, modify, view, and work with pivot tables.
For information on creating and modifying pivot tables, see Using the Analyzer.
-
Add links to web pages.
-
Delete public items displayed in the User Portal.
-
Display the Analyzer and perform additional analysis there. See Using the Analyzer.
Security
The system has a formal mechanism for managing access to Business Intelligence functionality, Business Intelligence items, and your data. This mechanism is based on the underlying InterSystems IRIS security framework. This section summarizes how this mechanism affects you.
For details, see the Implementing InterSystems Business Intelligence.
Security for Functionality
The User Portal and the Analyzer are secured as separate entities. You may or may not have read and write access to both these components. For example, you might have both read and write access for the User Portal (which would let you view and create dashboards), but only read access for the Analyzer (which would let you change a pivot table but not save the changes).
Security for Pivot Tables and Dashboards
Pivot tables, dashboards, and other items displayed in the User Portal are known as folder items and can be secured via resources. This works as follows:
-
An administrator performs the following setup:
-
Creating resources in the Management Portal.
-
Creating roles in the Management Portal. These roles can have either READ permission on a resource or both READ and WRITE permissions on a resource.
-
Assigning users to roles, which enables them to read (or read and modify) the items or items associated with a resource.
The administrator should then notify the Business Intelligence users about the available resources and how they are to be used.
-
-
When you save a folder item, you can type the name of the applicable resource into the Access Resource field.
Security for Model Elements
Business Intelligence model elements can also be secured via resources. This works as follows:
-
An administrator creates resources and roles, and assigns users to roles as described in the previous section.
-
Developers specify the resource (if any) that secures each cube, subject area, and KPI (key performance indicator).