
Business Intelligence Tutorial: Creating a Cube
In this page, we create a simple Business Intelligence cube.
Creating a Basic Cube
-
Access the Management Portal and go to the namespace into which you installed the samples, as described earlier.
-
Navigate to Home > Analytics > Architect.
-
Click New. The system displays a dialog box.
-
In this dialog box, specify the following:
-
Definition Type: Cube — Select this.
-
Cube Name — Tutorial
-
Source Class — Click the Browse button, select BI.Study.Patient, and click OK.
-
Class Name for the Cube — Tutorial.Cube
-
-
Click OK.
The system creates the cube class, which you can also view and modify in an IDE.
-
Click the bold top row in the middle area (labeled Tutorial). This selects the cube so that you can edit its details on the right.
-
In the Details Pane, type None into Null replacement string.
-
Click Save and then click OK.
The system updates the cube class.
The Class Viewer, which is the left area, now displays this:
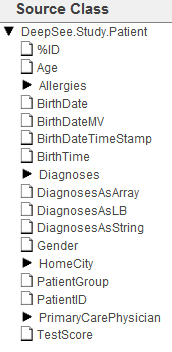
The Class Viewer provide a useful view of the class properties (apart from relationship properties) of your base class, which makes it very easy to create InterSystems IRIS Business Intelligence elements based on those properties. It is important, however, to know that although this view provides a convenient way to access some properties, you can also use a source expression to access any data. These source expressions are evaluated when the cube is built and thus do not affect your runtime performance. This tutorial demonstrates these points later.
Adding Levels and Measures
In this part of the tutorial, you add some levels and measures to the Tutorial cube.
-
Drag and drop the following items from the Class Viewer (the left area) to the Measures heading in the Model Viewer (the middle area):
-
Age
-
TestScore
This creates measures named Age and TestScore, based on the class properties with those names.
-
-
Make the following changes to the TestScore measure:
-
Click the measure name, below the Measures heading.
-
In the Details pane (the right area), change Name to Test Score
-
Click Searchable.
-
-
Create the Avg Age measure as follows:
-
Drag and drop the Age property again from the Class Viewer to the Measures heading in the Model Viewer.
This step creates a new measure named Age1.
-
Click the measure name in the Model Viewer and then edit the following details in the Details Pane:
-
For Name, specify Avg Age.
-
For Aggregate, choose AVG.
-
For Format String, specify #.##
-
-
-
Create the Avg Test Score measure as follows:
-
Drag and drop the TestScore property again from the Class Viewer to the Measures heading in the Model Viewer. This step creates a new measure named TestScore1.
-
Click the measure name in the Model Viewer and then edit the following details in the Details Pane:
-
For Name, specify Avg Test Score.
-
For Aggregate, choose AVG.
-
For Format String, specify #.##
-
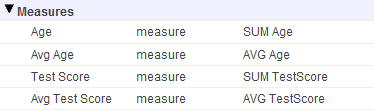
Now you should have four measures:
-
-
Click Save and then click OK.
The system updates the cube class.
-
Add a dimension, hierarchy, and level based on the Age property, as follows:
-
Drag and drop the Age property to the Dimensions heading.
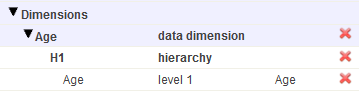
The Architect immediately creates a dimension, hierarchy, and level, and the Model Viewer now displays the following:
-
Click the first Age item, which is labeled data dimension.
-
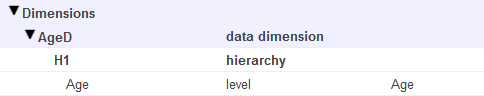
In the right area, edit Name to be AgeD.
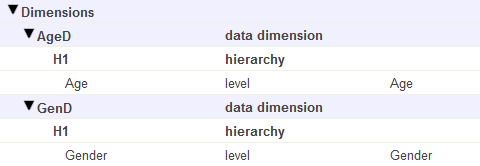
The Model Viewer now displays the following:
Depending on how you plan to use Business Intelligence, users might never see the names of the dimensions. In this tutorial, we follow the convention used in the Patients sample, which assumes that we will not use a dimension as rows or columns in pivot tables (we will instead use levels as rows or columns).
-
Select the option Enable the All level for this dimension.
-
Edit Caption for All member to be All Patients.
-
Edit Display name for All member to be All Patients.
-
-
Save the cube definition in the same way that you did earlier.
-
Add a dimension, hierarchy, and level based on the Gender property. Repeat the previous steps with the following differences:
-
Drag and drop the Gender property.
-
Rename the dimension to GenD.
The Model Viewer now displays the following:
-
-
Add a dimension, hierarchy, and level based on the HomeCity property. Repeat the previous steps with the following differences:
-
Expand the HomeCity property and then drag and drop the Name property within this folder to Dimensions
-
Rename the dimension to HomeD
-
Rename the level to City
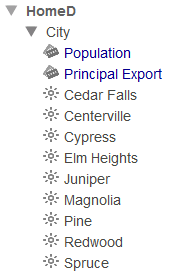
For this new dimension, hierarchy, and level, the Model Viewer now displays the following:
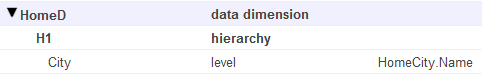
Note that in this case, the Property option uses dot syntax.
-
-
Add properties to the City level:
-
Expand HomeCity on the left (in the Class Viewer area).
-
Drag Population and drop it onto the City level in the middle area.
-
Drag PrincipalExport and drop it onto the City level in the middle area.
-
Select the new PrincipalExport property and rename it to Principal Export.
-
-
Add a dimension, hierarchy, and level based on the PrimaryCarePhysician property. To do this:
-
Click Add Element.
-
For Enter New Element Name, type DocD.
-
Click Data Dimension.
-
Click OK.
-
Click New_Level1 in the Model Viewer area.
-
Change Name to Doctor.
-
Select the Expression radio button under the Source Values header and copy the following ObjectScript expression into Expression:
%source.PrimaryCarePhysician.LastName_", "_%source.PrimaryCarePhysician.FirstNameThe variable %source refers to the current record. The system evaluates this expression when it builds the cube.
You could instead use the drag-and-drop procedure as you did earlier, and then edit the definitions.
-
-
Save the cube definition in the same way that you did earlier.
-
Compile and build the cube. To do so:
-
Click Compile, which starts the compilation and displays progress in a dialog box.
-
When the system is finished compiling, click Done.
-
Click Build. Note in the modal window that Selective Build appears selected by default, and that the measures and dimensions you've added appear in a list below, each checked for the Selective Build process. The addition of a new column or the modification of an existing column will always prompt for a Selective Build in this fashion. Click Build.
-
When the system is finished building the cube and its indexes, click Done.
-
-
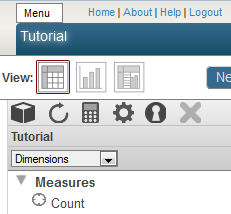
In a separate browser tab or window, open the Analyzer.
Check the upper left area, which displays the title of the currently selected cube or subject area. You should see the following:
If the title is not Tutorial, then click the Change button (
 ), click Tutorial, and click OK.
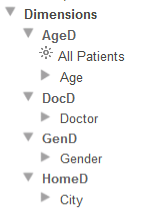
The left area of the Analyzer displays the current contents of this cube as follows:
If you do not see this, make sure that you have generated data for the sample and that you have compiled and built the cube.
Examining the Initial Cube
In this section, we examine the cube to see if there is anything we want to change.
To examine the cube, we will create simple pivot tables by dragging and dropping cube elements from the left area to the Pivot Builder area, which consists of the Rows area and the three boxes to its right.
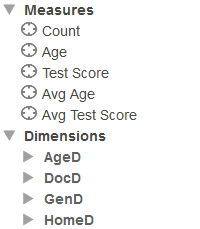
The first thing to notice is that the Analyzer displays a measure (Count) that we did not define. This measure is provided automatically, and it counts the records in the base class.
Do the following to get acquainted with the new cube:
-
Click the triangle next to each dimension name in the left area.
When you are done, you should see the following:
-
Drag and drop the Age level to the Rows area. You should see something like this:
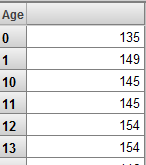
Notice that the members of this level are sorted as strings. For this level, it would be better to sort the members numerically, so we will have to make an adjustment.
-
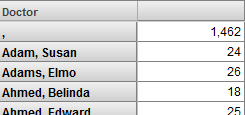
Drag and drop the Doctor level to the Rows area, placing it directly on Age. (In this action, you replace Age with Doctor.) Now you should see something like this:
 Note:
Note:Unlike the other dimensions created here, the Doctor dimension can have a very large number of members, depending on the size of your data set. In a real-world implementation, it is unlikely that you would create a dimension at such a low level. This tutorial uses this dimension to demonstrate a couple of key points.
The doctor name , refers to patients who do not have a recorded primary care physician (for these patients, both the last name and first name are null for the PrimaryCarePhysician field). We will change this when we redefine this level in the next part of the tutorial.
Whenever you create a level that is based on an identifier, it is important to consider whether that identifier is unique. In many cases (product names, procedure codes, department names, and so on), the identifier is unique. However, it is not safe to assume that names of people are unique. Because we have based this level directly on the doctors’ names, the system combines any doctors that have the same name.
For example, some patients could have a doctor named Agnes Djakovic, represented as row 17 in the Doctor table, and some other patients could have a doctor with the same name, but who is represented as row 380 in the same table. The Doctor level would have a member named Agnes Djakovic that combines those patients.
In a later part of the tutorial, we will use a more robust approach.
-
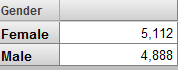
Drag and drop the Gender level to the Rows area, placing it directly on top of Doctor. This action replaces the Doctor level with the Gender level. Now you should see something like this:
We will not need to make any changes to this level.
-
Expand the City level on the left. You should see this:
-
Drag and drop the City level to the Rows area, placing it directly on top of Gender. Now you should see something like this:
-
Drag and drop the Population and Principal Export properties to Columns. You should see this:
We will not need to make any changes to this level.
Refining the Cube
In this part of the tutorial, we will make the following changes to the cube:
-
Change how the members of Age are sorted.
-
Ensure that the Doctor level does not combine doctors who have the same name
-
Ensure that the Doctor level has a member named None (the cube default replacement string) rather than ,
-
Access the Architect, which shows the cube definition you last looked at.
-
First, redefine the Age level so that its members are sorted numerically. To do so:
-
Click the Age level.
-
Click Add Element.
-
For Enter New Element Name, type AgeSort
-
Click Property.
-
Click OK.
The system adds the property and selects it in the Architect.
-
In the Details Pane, select Expression and enter the following:
$CASE($LENGTH(%source.Age),2:%source.Age,:"0"_%source.Age)This expression adds leading zeros to the age, so that string sorting causes the ages to be sorted correctly. The first age is 01, the second is 02, and so on. (The highest age in this sample is 99 years, so no age has more than two characters.)
-
For Sort members by property value, select asc.
This option causes the system to use the values of this property to control how the members are sorted.
-
Save the cube.
Note:The Patients sample uses a different approach, and both approaches are valid.
-
-
Redefine the Doctor level again so that it cannot combine doctors who have the same name. To do so:
-
Click the Doctor level.
-
Select the value in the Expression field and copy it to Notepad or other temporary location.
-
Select Property and enter PrimaryCarePhysician
Now the Doctor level is based on the bare PrimaryCarePhysician property, which is an OREF and is unique for each doctor.
This ensures that the level does not combine different doctors who happen to have the same name.
This step also ensures that the value is null for patients with no doctor; this means that the cube default null replacement string is used for that member of this level.
-
While the Doctor level is selected, click Add Element.
-
For Enter New Element Name, type DoctorName
-
Click Property.
-
Click OK.
The system adds the property and selects it in the Architect.
-
In the Details Pane, select Expression and paste in the expression you previously copied.
-
Select Use as member names.
This option causes the system to use the value of this property as the name for each member.
-
For Sort members by property value, select asc.
This option causes the system to sort the members in ascending order by the value of this property.
-
-
Compile the cube.
When you do so, the Architect saves the cube.
-
Build the cube.
-
Go to the Analyzer and click the Analytics > Analyzer link to refresh with the most current model.
-
Double-check the changes. You should see the following:
-
When you drag and drop Age to Rows, you see the members sorted in numeric order:
-
When you drag and drop Doctor to Rows, you see the None member:
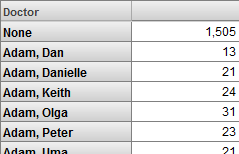
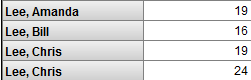
Depending on the generated data, you might also see duplicate doctor names. For example:
-
Adding a Listing to the Cube
A listing enables the users to see selected fields from the lowest-level data, which is useful in many scenarios. This information can help users identify outlier records or any records where follow-up activity might be needed.
-
First, let us examine the available fields in the Patients table.
-
Access the Management Portal and go to the namespace into which you installed the samples, as described earlier.
(If this is open on another browser tab, switch to that tab.)
-
Click System Explorer > SQL.
-
Click the Execute Query tab.
-
Execute the following query:
select * from bi_study.patientThis displays the first 1000 patients and shows the available fields.
-
Now try a query like the following:
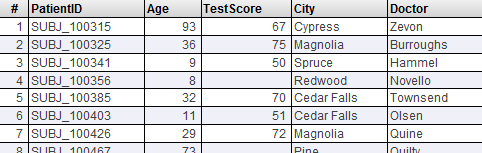
select patientid, age,testscore,homecity->name as "City", primarycarephysician->lastname as "Doctor" from BI_Study.Patient -
Copy the query to Notepad or to any other convenient temporary location.
Leave this browser tab or window open for later use.
-
-
Add a listing that uses the fields in the query we just ran:
-
Access the Architect.
(If this is open on another browser tab, switch to that tab.)
-
Click Add Element.
-
For Enter New Element Name, type SampleListing.
-
Click Listing.
-
Click OK.
The system adds the listing.
-
In the Details pane, copy the list of fields from the earlier saved query to the Field list area, removing select as seen below:
patientid, age,testscore,homecity->name as "City", primarycarephysician->lastname as "Doctor"The system uses this list of fields and builds the SQL query.
-
Compile the cube.
When you do so, the Architect saves the cube.
You do not need to rebuild the cube.
-
-
Verify that you can access this listing in the Analyzer. To do so:
-
Access the Analyzer.
(If this is open on another browser tab, switch to that tab and click the Analytics > Analyzer link to refresh with the most current model.)
-
Click a cell in the pivot table already displayed in the preview area, or create a simple pivot table and click a cell in it.
-
Click the Display Listing button
 .
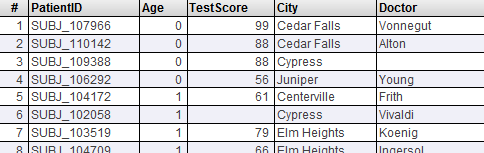
.The system displays something like the following:
 Note:
Note:The system displays the first 1000 records by default. You can change this within the Analyzer.
If you instead get a message that listings are not supported, make sure that you saved and recompiled the cube.
-
-
Modify the listing to sort the records in a different way:
-
Access the Architect again.
-
Click the listing in the Model Contents area.
-
In the Details pane, enter the following into Order By:
age,homecity->name -
Compile the cube.
When you do so, the Architect saves the cube.
-
-
Verify that the listing is now sorted by age, and then by city within age.
Display a listing as before. You should see something like this:
Scroll down to verify that patients are sorted by city within age.
Looking at the Fact and Level Tables
If you are responsible for creating cube definitions, it is useful to understand how the system uses the cube definition to build the tables that the system uses directly: the fact table and level tables. In this section we examine these tables.
-
Access the Management Portal and go to the namespace into which you installed the samples, as described earlier.
-
Click System Explorer > SQL.
-
Click the Execute Query tab.
-
Execute the following SQL query, which runs against the base table used by your cube:
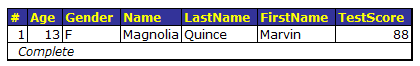
select top 1 age,gender,homecity->name,primarycarephysician->lastname,
primarycarephysician->firstname, testscore from BI_Study.patient
Make a note of the details:
-
In the left area, navigate to the table Tutorial_Cube.Fact.
-
Click Open Table.
The system displays something like the following:
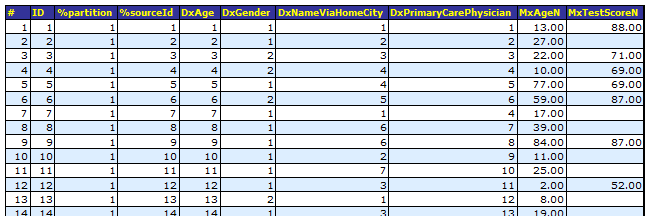
This table is generated when you compile a cube and is populated when you build the cube. The fact table has one row (called a fact) for each record that it used from the source table. In this case, each fact corresponds to one patient.
The first row in this table corresponds to the first row in the base table (who is 13 years old and who has a test score of 88).
-
Note the following points:
-
The %sourceId field indicates the ID of source record on which a fact was based.
-
Each field with a name that starts Dx corresponds to a level that you defined. The fact table stores integers in these fields, which refer to records in the level tables.
-
Each field with a name that starts Mx corresponds to a measure that you defined. The fact table stores numbers (rather than integers) in these fields, because that is the default type for measures.
-
For some facts, the value of the MxTestScore field is null.
-
-
Click Close window.
-
Navigate to the table Tutorial_Cube.StarGender.
-
Click Open Table. The system displays something like this:
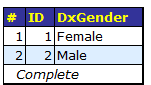
This table contains the names of the members of the Gender level. The DxGender field of the fact table refers to the rows in this table.
In your case, you might see Male before Female.
In this case, the Female member is first, because the first patient processed by the system is female.
When the system populates these tables, it iterates through the records in the base table. For each record, the system looks at the definition of each level, determines a value, adds that value (if needed) to the corresponding level table, and writes a lookup value into the level field of the fact table.
-
Click Close window.
-
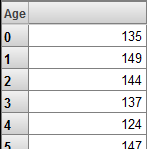
Navigate to the table Tutorial_Cube.StarAge. The system displays something like the following:
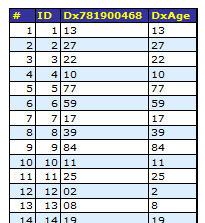
The Age level is defined by the Age field of the base class; that value is shown in the DxAge column. This level has a level property that is used to define the sort order for the level members; that value is shown in the Dx781900468 column.
The first record in this level table corresponds to the age of 13 years, the first patient processed by the system in this example.
-
Click Close window.
-
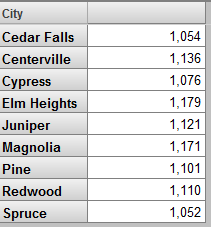
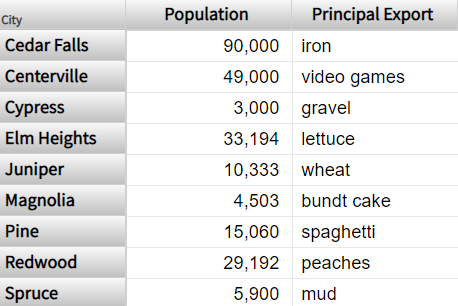
Navigate to the table Tutorial_Cube.StarNameViaHomeCity. The system displays something like the following:
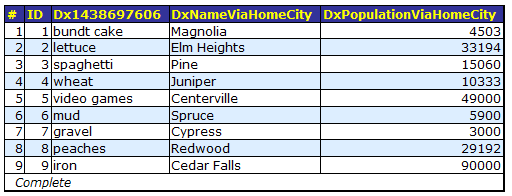
The City level is defined by the HomeCity->Name field in the base class; that value is shown in the DxNameViaHomeCity column. This level has two level properties that are shown in the other columns.
The first record in this table is Magnolia, the home city of the first patient in the base table.
-
Click Close window.
-
Navigate to the table Tutorial_Cube.StarPrimaryCarePhysician. The system displays something like the following:
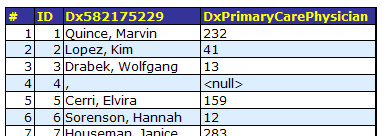
The Doctor level is defined by the PrimaryCarePhysician field in the base class, which is a reference (OREF) to an instance of the BI.Study.Doctor class. The system converts the OREF to an integer and writes it into the DxPrimaryCarePhysician column.
For this level, the member names are defined by a level property that concatenates the last name and first name, with a comma between them. The value of this level property is stored in the Dx582175229 column.
The first doctor in this table is Quince, Marvin, the primary care physician of the first patient in the base table.
The name of the null doctor is a comma, but this name is never shown; instead, for this member, the system uses the null replacement string that you specified.
To make the field names in these tables more useful, you can specify the option Field name in fact table for the levels and measures that you define. Note that this option does not apply to time levels (discussed in the next article), which have special internal handling.