
Orientation to Dashboards
This page reviews the contents of the dashboards that you may already have in your system. It is intended as an orientation to the possible contents of your dashboards. For information on using the elements described here, see Using Dashboards.
Also see Accessing the BI Samples.
Overview of Dashboards
The following example shows a sample dashboard:
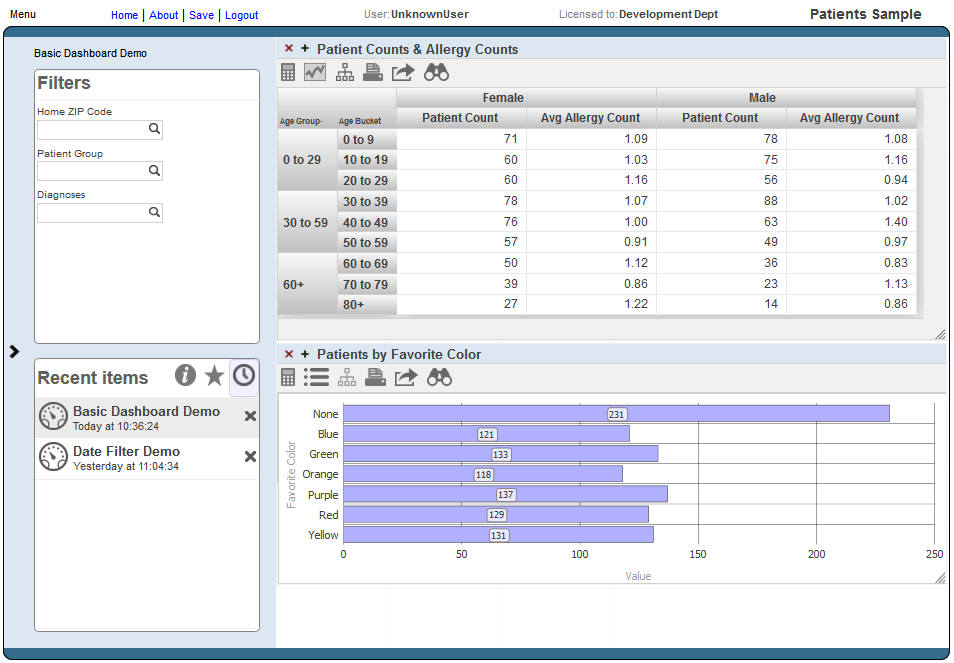
A dashboard consists of the following areas:
-
The upper left displays the name of the dashboard and (if defined) its title.
-
Depending on the system configuration and on the individual layout of a dashboard, a dashboard can include zero, one, or two worklist areas on the left. For any worklist area, the upper right corner displays icons to indicate which worklists it can display. For example:
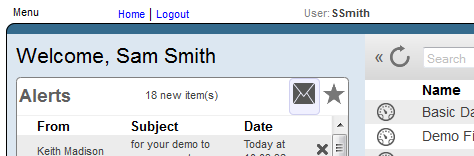
The highlighted icon indicates which worklist is currently displayed. You can select a non-highlighted icon to display the corresponding worklist in this area instead.
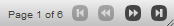
The Filters worklist is specific to the dashboard. To access this, select the Filters icon
 . For example:
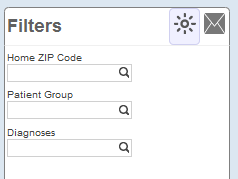
-
The right area contains one or more widgets. Each widget is a rectangular panel that displays data in some form.
Widget Variations
This section shows the contents of different types of widgets that you might see in your dashboards.
Pivot Table Widgets
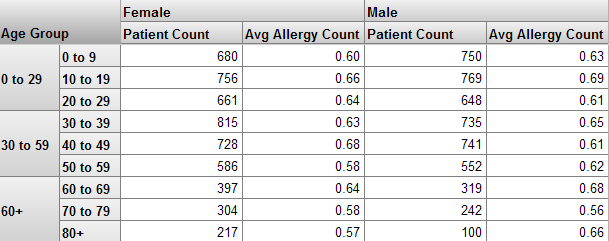
A pivot table widget displays data in one of three formats:
-
As a table with aggregated values. For example:
-
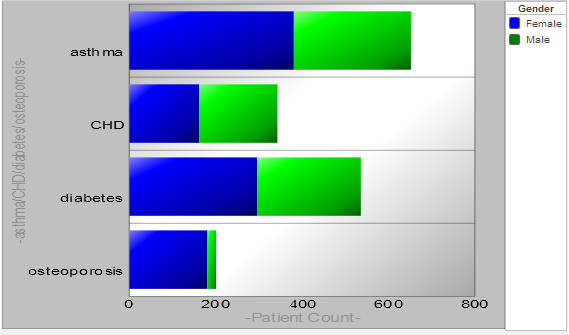
As a chart. For example:
-
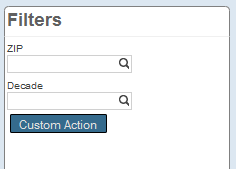
As a listing, which is a table of the lowest-level values. For example:
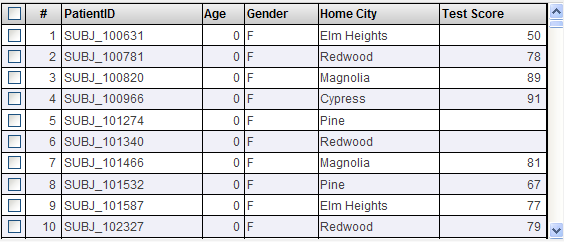
If there are more than 100 rows, the bottom area displays buttons that you can use to page through all the rows.
Scorecard Widgets
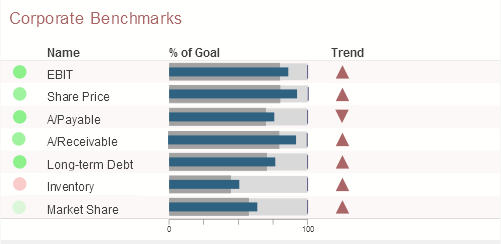
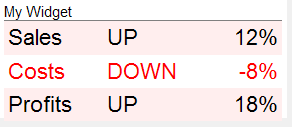
A scorecard widget displays one or more rows of data in a tabular format that also includes features such as value-dependent lamps and arrows. For example:
Meter Widgets
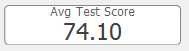
A meter widget displays one or more values, each in a graphical object as follows:
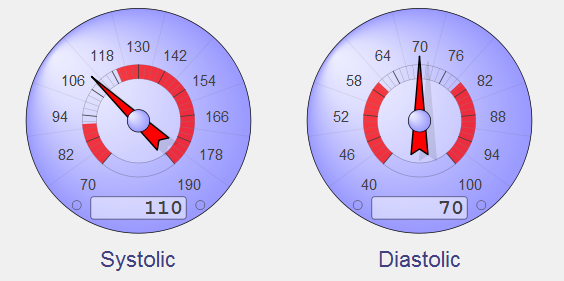
The preceding picture shows a speedometer. The system also supports text meters. For example:
Map Widgets
A dashboard can include a map widget like the following:
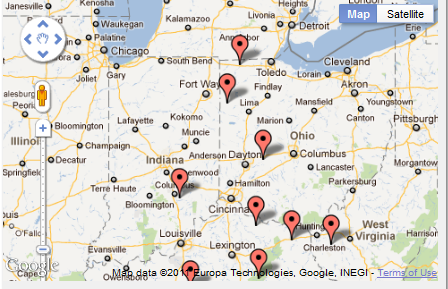
The highlighted points typically correspond to locations that are relevant to your business.
Calendar Widgets
A dashboard can include a calendar widget like the following:
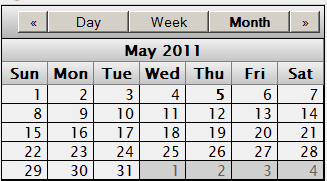
This widget is included purely as information; it is not connected to your data.
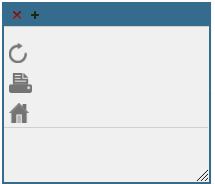
Controls Widgets
A controls widget consists only of toolbar controls and has no main body content. The following shows an example:
Custom Widgets
A dashboard can also include custom widgets called portlets. The following shows an example:
Data Sources for Widgets
Most widgets use a data source, which is one of the following:
-
A pivot table. Pivot tables are created in the Analyzer. A pivot table is a query that is created by drag and drop actions.
In some cases, you can launch the Mini Analyzer and make local changes to the pivot table. Changes do not affect other widgets, other dashboards, or other users. For details, see Other Tasks.
-
A KPI (key performance indicator). A KPI is a more advanced query created by a programmer.
All of these data sources can be displayed in pivot table widgets, scorecard widgets, and meter widgets.
Widget Basics
A widget might or might not include a title bar with buttons, as follows:

The title bar may or may not include a title.
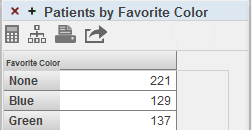
Most widgets include scroll bars when necessary. A pivot table instead includes paging buttons like the following example:
If a pivot table displays nested rows and if there are more than 100 rows, the system initially accesses the first 100 rows and displays the Show All button instead of these paging buttons. If you select the Show All button, the system accesses all the rows and then displays the paging buttons.
Depending on how the dashboard is configured, the lower right corner of each widget can include a resize handle:

Locations of Controls and Buttons
A dashboard can include controls and graphical buttons. Depending upon the dashboard design, you see these items in either or both of the following locations:
-
In the Filters worklist of the dashboard. For example:
These items typically affect the entire dashboard.
-
In the toolbars of the widgets included in the dashboard. For example:
These items typically affect only the widget in which they are displayed, but they could possibly affect other widgets.
Using Dashboards provides information on using these options.
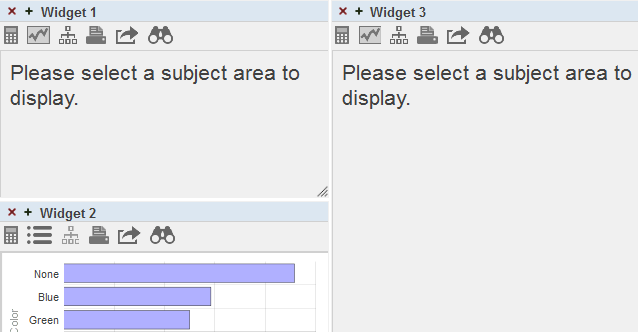
Empty Widgets
There are two scenarios in which you might see empty widgets.
In the first scenario, a widget (or the underlying pivot table, if applicable) has been deliberately configured not to automatically execute when you open the dashboard. (This configuration can be useful when a pivot table uses a long-running query.) In this scenario, the widget should include a refresh button  , which you use to force the widget to display its contents. If there is no such button, contact the owner of the dashboard.
In the second scenario, if the system cannot find some of the data that the dashboard uses, the system displays as much of the dashboard as possible. For any affected widget, the system displays something like this:
This typically indicates that someone has either renamed or deleted the data source used by this widget; it could also indicate that you do not have permission for the data in this widget. Contact the creator of the dashboard or reconfigure the widget yourself; see Creating Dashboards.