
Introduction to the Analyzer
This page introduces the InterSystems IRIS® data platform Business Intelligence Analyzer.
You can access the Analyzer from the InterSystems launcher or from the InterSystems User Portal.
Introduction
The Analyzer enables you to create pivot tables, which display aggregated data. Each pivot table is based upon a subject area or a cube. (In the Analyzer, the terms subject area and cube are equivalent to each other; this book uses the term subject area.) When you access the Analyzer, you must choose the subject area to work with. The Analyzer then displays the elements defined in that subject area, which you drag and drop to create pivot tables.
Pivot tables are central to InterSystems Business Intelligence; they select and aggregate data. The following figure shows an example pivot table that shows the number of patients and the average allergy count per patient, grouped by age and gender.
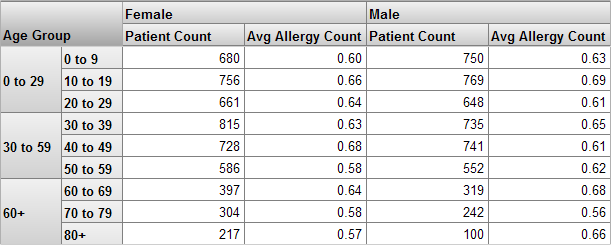
A level is used to group the source data. A level has members. Each member, in turn, corresponds to a specific set of records in the source data. For example, the Age Group level has the members 0-29, 30-59, and 60+. The Gender level has the members Female and Male.
A measure is a value displayed in the body of the pivot table; it is based on values in the source data. For a given context, a measure aggregates the values for all applicable source records and represents them with a single value. For example, the measure Patient Count is the number of patients, and the measure Avg Allergy Count is the average number of allergies per patient.
The preceding example shows a preview of a pivot table within the Analyzer, which provides a large set of tools for modifying, exporting, formatting, and so on.
Accessing the Analyzer
To access the Analyzer:
-
On your BI instance, log in to the management portal as a user with administrative privileges and ensure you are in your desired namespace.
-
Navigate to Analytics > Analyzer.
If you see the message Select a Subject Area to Display, do the following:
-
Click the Change button
 or click the Select Subject Area link.
 -
Click the name of the subject area.
-
Click OK.
-
Accessing the Mini Analyzer
To access the Mini Analyzer, you must first display a suitable dashboard. Not all dashboards provide access to the Mini Analyzer.
If a dashboard displays the Mini Analyzer button  in a widget, click it; the system then opens the current pivot table in the Mini Analyzer.
The Mini Analyzer includes only the options that let you make local changes to the pivot table as displayed in this widget. The changes do not affect other widgets, other dashboards, or other users.
Orientation to the Analyzer and Mini Analyzer
This section provides an orientation to the Analyzer and Mini Analyzer. First, consider the upper part of the Analyzer page (which is not included in the Mini Analyzer):

The key options here are as follows:
-
Menu — This drop-down menu provides options to open and save pivot tables.
-
Home — This link accesses the User Portal.
-
Analytics — This link accesses other Analytics tools.
-
Analyzer — This link redisplays the Analyzer. This is useful if there have been changes to the definition of the subject area.
-
Namespace — The displayed namespace name is a link that lets you switch to another InterSystems IRIS namespace.
-
View — These buttons switch the pivot table display to a chart format or to a table-and-chart format.
-
New — This button lets you create a new pivot table.
-
Open, Save, and Save As — These buttons let you open and save pivot tables.
-
Delete — This button lets you delete the current pivot table.
-
Auto-execute — This check box lets you control whether the system automatically executes the pivot table.
-
Preview Mode — This check box enables Preview Mode. If Preview Mode is enabled, any sets involved in a CROSSJOIN are truncated using the HEAD function. If truncation occurs, a preview pivot table is displayed in the Analyzer. You can use the Show All button to display full results without affecting the Preview Mode setting.
Note:The Analyzer automatically enables Preview Mode for a pivot table which involves a resource-intensive query. This avoids the need to recalculate complete results for the query every time you make an edit to the pivot table.
The upper left corner displays the name of the currently selected subject area (in this case, DemoMDX) or the pivot table that you currently editing, if any.
The rest of the page is visible in both the Analyzer and the Mini Analyzer. The following subsections discuss the Model Contents pane, the Pivot Builder area, and the Pivot Preview area. The final subsection discusses how the Mini Analyzer is different from the full Analyzer.
Model Contents Pane
Both the Analyzer and the Mini Analyzer include the Model Contents pane on the left. This area lists the contents of the subject area that you are currently viewing:
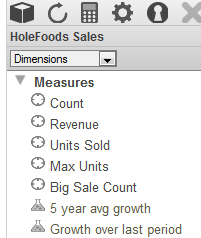
See Getting Familiar with a Subject Area for more detail.
During development, you may find it necessary to reload the model if you have made changes in the Architect or an IDE. To reload the model, click the Refresh button  in this area. Note that this does not rerun the pivot table; it affects only the model as shown in this area.
You can resize this area. To do so, drag the vertical divider on the right edge of this area.
Pivot Builder Area
To the right of the Model Contents pane, both the Analyzer and the Mini Analyzer include the Pivot Builder area, where you define a pivot table:
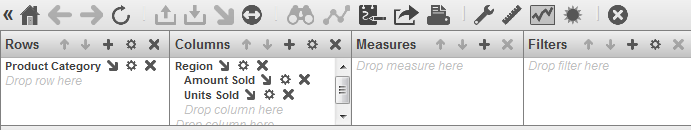
You can vertically resize this area. To do so, drag the horizontal divider on the bottom edge of this area. You can also horizontally resize each of the boxes; to do so, drag the dividers between boxes.
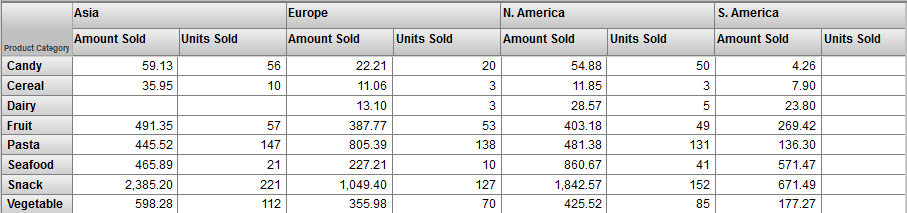
Pivot Preview Area
Both the Analyzer and the Mini Analyzer include the Pivot Preview area, which displays a preview of the actual pivot table:
The bottom area looks like this:
Cells displays the number of cells currently selected (or the total number of cells on the page if there is no selection). Total displays the total value of all the selected cells (or of all the cells on the page if there is no selection).
If there is too much data to display on the screen, the lower right corner displays buttons for paging through the results.
You can resize this area. To do so, drag the horizontal divider on the top edge of this area.
Mini Analyzer Differences
The Mini Analyzer is similar to the full Analyzer but has two key differences:
-
The Mini Analyzer does not provide options for creating new pivot tables, only for changing the currently displayed pivot table.
-
The changes are visible only to yourself. Other users are unaffected.
For information on accessing the Mini Analyzer, see the previous topic.
Displaying a Pivot Table
To display an existing pivot table, do either of the following:
-
Click Open, expand folders as needed, select a pivot table, and click OK.
-
Select Pivots in the Model Contents area. Then expand folders as needed and select a pivot table.
The system immediately runs the query defined by the pivot table and then displays the results unless the Auto-execute option is off. In this case, click the Refresh button in the Pivot Builder area. The system then runs the query and displays the table.
Exiting the Analyzer or Mini Analyzer
To exit the Analyzer and return to the User Portal, click Home. Any unsaved changes are discarded.
To exit the Mini Analyzer and return to the dashboard from which you started, click either OK or Cancel. The OK option saves your changes, and the Cancel option discards them. Or click Reset to remove any changes created in the Mini Analyzer, and then click OK.
Location of Pivot Table Definitions
When you create a pivot table in the Analyzer, its definition is available within your IDEOpens in a new tab as a generated .dfi file. If you are using Visual Studio CodeOpens in a new tab, you can access these pivot table definitions in the following ways:
-
Client-side editing: when a namespace is opened in the ObjectScript ExplorerOpens in a new tab, view the .dfi files in the Other directory.
-
Server-side editing: modify your workspace filtersOpens in a new tab so that they show generated files and include .dfi files.
A pivot table definition is not a class definition but can be copied and pasted into a special container class if needed; this container class can contain multiple pivot tables and other items. For details, see Packaging Business Intelligence Elements into Classes.
Accessing the BI Samples
Most of the samples shown in the BI documentation are part of the Samples-BI sample (https://github.com/intersystems/Samples-BIOpens in a new tab) or the Samples-Aviation sample (https://github.com/intersystems/Samples-AviationOpens in a new tab).
InterSystems recommends that you create a dedicated namespace called SAMPLES (for example) and load samples into that namespace. For the general process, see Downloading Samples for Use with InterSystems IRIS.