
Tracing the Path of Related Messages (Visual Trace)
The Visual Trace page enables you to visually trace the path of a set of related messages between business hosts.
Accessing the Visual Trace
You can access this tool from multiple places. For example:
-
Access the Interoperability > View > Messages page.
-
Select a message.
-
Select the Trace tab, which displays a small version of the trace.
-
Select View Full Trace.
Basics
The left area of the Visual Trace page displays a visual representation of message activity, and the right area displays details for the selected message (if any; see Viewing the Message Details).
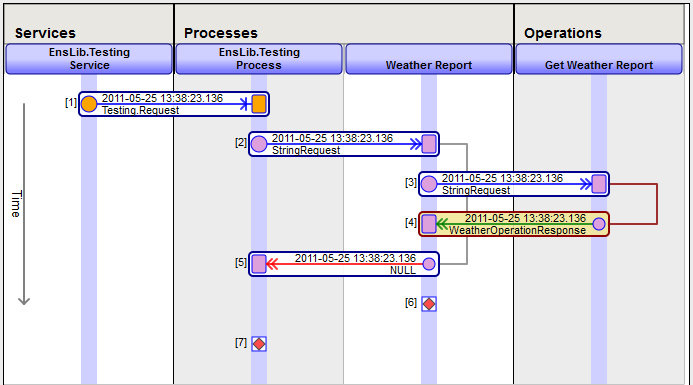
The trace displays one column for each business host that handles the message. The business hosts are grouped into business services, business processes, and business operations.
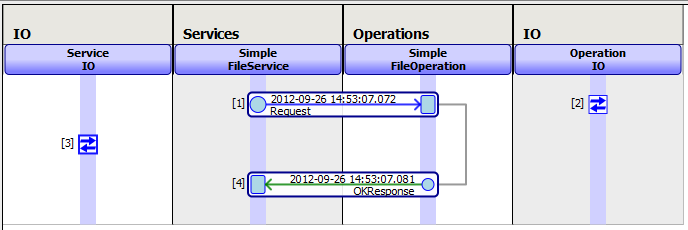
If you enable the Archive IO setting for one or more business service and business operations, the Visual Trace also displays the input and output data in addition to the production messages. For example:
When you view calls with this tool, synchronous calls from long-running business processes are portrayed as if they were asynchronous. This does not change the fact that the calls are actually synchronous. It is a side effect of the internal tracking mechanism that InterSystems IRIS uses to free system resources while it is waiting for a synchronous call to return.
When a message has traveled from one item to the next, an arrow connects the two items within a rounded box:
-
The source item is marked with a circle; this is the item that sends the message.
-
The target item is marked with a rounded rectangle. The arrow points to this item, away from the source item.
In both cases, you can read the name of the business host at the top of the column.
Each of these rounded boxes corresponds to a message and displays information as follows:
-
A number in square brackets outside the box on left is the message identifier.
-
A date and time within the box above the arrow indicates the message creation time stamp. See Invocation Style and Message Time Stamps.
-
The arrow is displayed in color. Normal request message arrows are blue; responses are green. If a message encountered an error, its arrow is red.
-
The text below the arrow is the message name.
Additional lines indicate when a given business host receives and later sends a message.
If there are more messages than will display on a page, you can use the Items per page drop-down to control the number of items displayed. You can either use the Go to items drop-down or the Previous Page and Next Page links to scroll through the pages.
If a message is sent out from an outbound HTTP adapter to another interoperability-enabled namespace, the incoming message is assigned a new SessionID. If you want to associate the related messages across namespaces, you can use the SendSuperSession setting. If this setting is specified on an outbound HTTP adapter, the adapter sets the SuperSession property in the HTTP header. This header property is preserved through the incoming HTTP adapter and preserved throughout the production. For details, see SendSuperSession.
Filtering the Display
If there are many messages shown in the full trace, it can be useful to limit the messages displayed by using a filter. This is also useful if you are trying to find messages that are related to an ACK or Archive IO message. The Apply Filter drop-down allows you to restrict messages in the following ways:
-
To filter for the matching request or reply for a specific message—select the message and then select Corresponding from the Apply Filter drop-down menu. This selection limits the messages displayed to the following:
-
All preceding messages with the target set to the source of the selected message.
-
If a request message is selected, the corresponding response message.
-
If a response message is selected, the corresponding request message.
-
If an ACK or IOLog message is selected, the corresponding request or reply.
-
-
To filter for all messages with a specific component as either the source or target of the message—select the column for the component and then select Host from the Apply Filter drop-down menu. This selection limits the messages to those having either a source or target of the selected component.
-
To filter for all messages having the same source and target as a specific message—select the message and then select Host from the Apply Filter drop-down menu. This selection limits the messages to those that have both the same source and same target as the selected message.
When you apply a filter, the message trace displays the filter it is applying. For example:
Filter = SourceHost:MsgRouter250, TargetHost:TCPOp001
Once you have applied a filter, the Apply Filter label changes to Reapply Filter. If you change the selection of the value of the drop-down menu, you must select Reapply Filter to change filters.
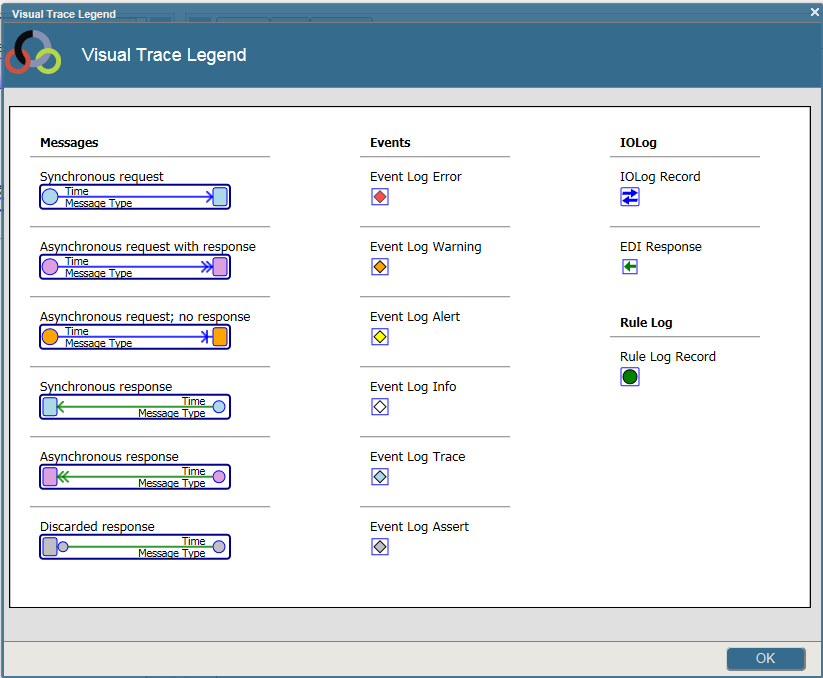
Visual Trace Legend
If you select Legend, InterSystems IRIS displays a popup guide with additional information, as follows: