
Troubleshooting SOAP Problems in InterSystems IRIS
This topic provides information to help you identify causes of SOAP problems in InterSystems IRIS® data platform.
For information on problems that are obviously related to security, see Troubleshooting Security Problems. In the rare case that your SOAP client is using HTTP authentication, note that you can enable logging for the authentication; see Providing Login Credentials in Sending HTTP Requests.
Information Needed for Troubleshooting
To identify the cause of a SOAP problem, you typically need the following information:
-
The WSDL and all external documents to which it refers.
-
(In the case of message-related problems) Some form of message logging or tracing. You have the following options:
Option Usable with SSL/TLS? Shows HTTP headers? Comments InterSystems IRIS SOAP log Yes Optionally For security errors, this log shows more detail than is contained in the SOAP fault. Web Gateway trace Yes Yes For problems with SOAP messages that use MTOM (MIME attachment), it is crucial to see HTTP headers. Third-party tracing tools No Depends on the tool Some tracing tools also show lower-level details such as the actual packets being sent, which can be critical when you are troubleshooting. These options are discussed in the following subsections.
It is also extremely useful to handle faults correctly so that you receive the best possible information. See SOAP Fault Handling.
InterSystems IRIS SOAP Log
To log the SOAP calls made to or from an InterSystems IRIS namespace, enable SOAP logging as described here.
The SOAP log is voluminous, so it is important to enable it only when needed and disable it as soon as possible. See the notes below for details.
To log SOAP calls for a namespace, set nodes of the ^ISCSOAP global in that namespace as follows:
 Set ^ISCSOAP("LogFile")=filename
 Set ^ISCSOAP("Log")=optionString
 Set ^ISCSOAP("LogMaxFileSize")=optionalMaxLogSize
You can also set additional nodes to further fine-tune what is logged:
 Set ^ISCSOAP("LogURL",optionalUrlMatch)=""
 Set ^ISCSOAP("LogJob",optionalJobId)=""
 Set ^ISCSOAP("LogClass",optionalClassname)=""
Where:
-
optionString specifies the type of data to include in the log. Use a combination of the following case-sensitive values:
-
i — Log inbound messages.
-
o — Log outbound messages.
-
s — Log security information. Note that this option provides more detail than is generally contained in the SOAP fault, which is intentionally vague to prevent follow-on security attacks.
-
h — Log only SOAP headers. You must combine h with i and/or o. When you use h with i, the log includes only the SOAP Envelope and Header elements for inbound messages. Similarly, when you use h with o, the log includes only the SOAP Envelope and Header elements for outbound messages. The corresponding SOAP Body elements are not logged.
-
H — Log HTTP headers. You must combine H with i and/or o. When you use H with i, the log includes HTTP headers for inbound messages. Similarly, when you use H with o, the log includes HTTP headers for outbound messages. HTTP headers are logged in addition to any SOAP data.
Note that this option also logs HTTP headers for SOAP messages received by web services within Interoperability productions (that is, received by subclasses of EnsLib.SOAP.ServiceOpens in a new tab),
You can use a string that contains any combination of these values, for example: "iosh"
-
-
filename is the complete path and filename of the log file to create.
-
optionalMaxLogSize is the maximum size of the log file, in bytes. When this maximum is reached, no more entries are written to the log file. This setting is optional.
-
optionalUrlMatch is a string that specifies the URL pattern to match. If this option is specified, only traffic using this URL pattern is written to the log. This string can be an exact URL or can include a leading * wildcard, a trailing * wildcard, or both.
-
Example with exact URL: http://localhost:8080/instance/csp/custom/WebService.cls?CfgItem=SoapLogIn
-
Example with leading wildcard : */instance/csp/custom/WebService.cls?CfgItem=SoapLogIn
-
Example with trailing wildcard: http://localhost:8080/instance/csp/custom/WebService.cls*
-
Example with both leading and trailing wildcards: */instance/csp/custom/WebService.cls*
Note: To match in all scenarios (client and server), use both leading and trailing wildcards.
Example:
Set ^ISCSOAP("LogURL","/instance/csp/custom/WebService.cls")="" -
-
optionalJobId is the ID of a job (process). This can be the ID of any of the following:
-
The web client process
-
The Web Gateway process running the web service (whether the service is part of a production or not)
Note that the Web Gateway operates a pool of processes, any one of which might service a request. Also, the Web Gateway may recycle and open new connections and the LogJob setting would need to be updated to follow.
-
The production process, in the case of a web service that is part of a production
These job IDs can be seen in the Management Portal. If a job ID is no longer valid due to that process stopping, the logging will not automatically delete obsolete job ID entries.
For example:
Set ^ISCSOAP("LogJob",15712)="" Set ^ISCSOAP("LogJob",16108)="" -
-
optionalClassname is the name of a class. For example:
 Set ^ISCSOAP("LogClass", "WSDL.SoapLog.Service" )=""  // SOAP Client classname
 Set ^ISCSOAP("LogClass", "WSDL.SoapLog.Client.SoapLogServiceSoap" )=""  // SOAP Service classname
The log indicates the sender or the recipient as appropriate, so that you can see which web service or client participated in the exchange.
The following shows a partial example of a log file with line breaks added for readability:
01/05/2022 13:27:02 *********************
Output from web client with SOAP action = https://www.mysecureapp.org/GSOAP.AddComplexSecureWS.Add
<?xml version="1.0" encoding="UTF-8" ?>
<SOAP-ENV:Envelope xmlns:SOAP-ENV='https://schemas.xmlsoap.org/soap/envelope/'
...
  <SOAP-ENV:Header>
      <Security xmlns="https://docs.oasis-open.org/wss/2004/01/oasis-200401-wss-wssecurity-secext-1.0.xsd">

  </SOAP-ENV:Header>
  <SOAP-ENV:Body>
...
   </SOAP-ENV:Body>
</SOAP-ENV:Envelope>


**** Output HTTP headers for Web Client
User-Agent: Mozilla/4.0 (compatible; InterSystems IRIS;)
Host: hostid
Accept-Encoding: gzip


**** Input HTTP headers for Web Client
HTTP/1.1 200 OK
CACHE-CONTROL: no-cache
CONTENT-ENCODING: gzip
CONTENT-LENGTH: 479
CONTENT-TYPE: application/soap+xml; charset=UTF-8
...


01/05/2022 13:27:33 *********************
Input to web client with SOAP action = https://www.mysecureapp.org/GSOAP.AddComplexSecureWS.Add

ERROR #6059: Unable to open TCP/IP socket to server devsys:8080
string
Note the following points:
-
With InterSystems IRIS XML tools, you can validate signatures of signed XML documents and decrypt encrypted XML documents. If you perform these tasks in this namespace, the log contains details for them as well. See Using XML Tools.
-
The InterSystems IRIS SOAP log captures SOAP calls even when no message is sent on the wire (that is, when the service and client are both on a single machine).
-
If a severe error occurs, the system stops writing to the SOAP log. See the messages log instead. For information, see Monitoring Log Files.
-
The Task Manager CheckLogging task, which runs every night, creates an alert if SOAP logging is left on for too long (by default, 2 days). Because the SOAP log is voluminous, it is important to pay attention to this alert.
-
The SOAPLogContains() method of %SOAP.WebBaseOpens in a new tab reads through the current SOAP log trying to match lines that meet criteria specified by arguments to the method.
HTTP Trace in the Web Gateway
The Web Gateway management page enables you to trace HTTP requests and responses. See Using the HTTP Trace Facility.
Third-Party Tracing Tools
To test your web service, you can use third-party tracing tools.
Tracing tools enable you to see the actual method call, as well as the response. A tracing session listens on a certain port, shows you the messages it receives there, forwards those messages to a destination port, shows the responses, and forwards the responses to the listening port.
For example, suppose you have a web service at https://devsys/csp/mysamples/GSOP.Divide.CLS
And suppose you have a web client that you created to talk to that service. The web client has a LOCATION parameter equal to "https://devsys/csp/mysamples/GSOP.Divide.CLS"
To trace messages between the client and service, you need to do two things:
-
In the tracing tool, start a tracing session that listens on port 8080 (for example) and that uses the destination port 52773.
-
In the web client, edit the LOCATION parameter to use port 8080 instead of 52773. Then recompile.
Or, in your code that invokes the web client, change the Location property of the web client:
 //reset location to port 8080 to enable tracing
 set client.Location="https://devsys:8080/csp/mysamples/GSOP.DivideWS.cls"
Now when you use the web client, the tracing tool intercepts and displays messages between the client and the web service, as shown in the following example:
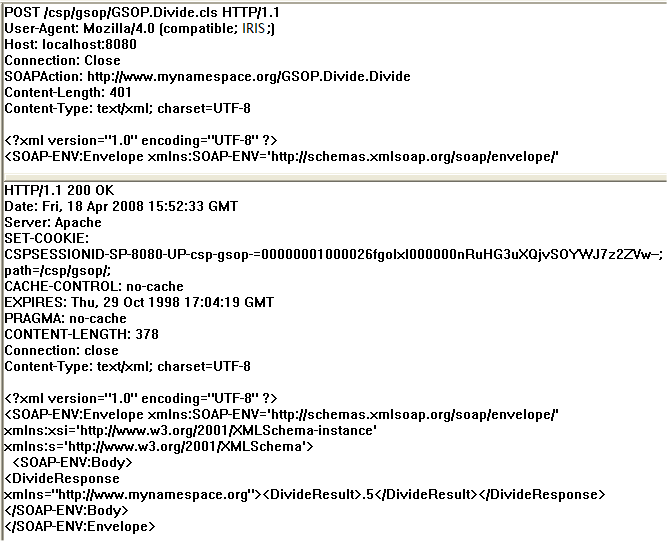
The top area shows the request sent by the client. The bottom area shows the response sent by the web service.
Problems Consuming WSDLs
You may see an error while generating client classes for several reasons:
-
The WSDL URL that you supplied may require authentication with an SSL certificate, and you did not specify an SSL configuration or you specified an incorrect SSL configuration. If so, an error message appears, for example:
ERROR #6301: SAX XML Parser Error: invalid document structure
while processing Anonymous Stream at line 1 offset 1
To correct this error, you can specify the appropriate SSL configuration.
-
The WSDL URL that you supplied requires authentication with a username and password. If so, an error message appears, for example:
ERROR #6301: SAX XML Parser Error: Expected entity name for reference while processing Anonymous Stream at line 10 offset 27Note:While the line and the offset values may vary, they will differ from those in the previous scenario.
To correct this error, you can specify a username and password as described in Generating the Client Classes, and Using a Password-Protected WSDL URL.
-
The WSDL may contain references to externally defined entities that could not be resolved before 10-second timeout period. If so, an error message appears, for example:
ERROR #6416: Element 'wsdl:definitions' - unrecognized wsdl element 'porttype'To correct this error, you can check the WSDL for <import> and <include> directives, for example:
<import namespace="https://example.com/stockquote/definitions"
           location="https://example.com/stockquote/stockquote.wsdl"/>
If you find such directives, take the following steps:
-
Download the primary WSDL to a file.
-
Download the referenced WSDL to a file.
-
Edit the primary WSDL to refer to the new location of the referenced WSDL.
Similarly, you can check whether the WSDL refers to other documents using a relative URL, for example:
xmlns:acme="urn:acme.com.:acme:service:ServiceEndpointInterface"If you downloaded the WSDL to a file, you cannot use relative references. Instead, you must also download the referenced document and edit the WSDL to point to its new location.
-
-
The WSDL contains <message> elements with multiple parts and uses document-style binding. If so, an error message appears, for example:
ERROR #6425: Element 'wsdl:binding:operation:msg:input' - message 'AddSoapOut' Message Style must be used for document style message with 2 or more parts. -
The WSDL is invalid. If so, an error message appears, for example:
ERROR #6419: Element 'wsdl:binding:operation' - inconsistent
soap:namespace for operation getWidgetInfo
The error message specifies the problem with the WSDL. In this example, the <operation> element in the following WSDL excerpt produced the error:
<?xml version="1.0" encoding="UTF-8"?>
<wsdl:definitions targetNamespace="https://acme.acmecorp.biz:9999/widget/services"
                  xmlns="https://schemas.xmlsoap.org/wsdl/"
                  xmlns:wsdl="https://schemas.xmlsoap.org/wsdl/" =
                 [parts omitted]>
  <wsdl:message name="getWidgetInfoRequest">
  </wsdl:message>
  <wsdl:message name="getWidgetInfoResponse">
    <wsdl:part name="getWidgetInfoReturn" type="xsd:string"/>
  </wsdl:message>
  <wsdl:portType name="Version">
    <wsdl:operation name="getWidgetInfo">
      <wsdl:input message="impl:getWidgetInfoRequest" name="getWidgetInfoRequest"/>
      <wsdl:output message="impl:getWidgetInfoResponse" name="getWidgetInfoResponse"/>
    </wsdl:operation>
  </wsdl:portType>
  <wsdl:binding name="VersionSoapBinding" type="impl:Version">
    <wsdlsoap:binding style="rpc" transport="https://schemas.xmlsoap.org/soap/http"/>
    <wsdl:operation name="getWidgetInfo">
      <wsdlsoap:operation soapAction=""/>
      <wsdl:input name="getWidgetInfoRequest">
        <wsdlsoap:body encodingStyle="https://schemas.xmlsoap.org/soap/encoding/"
                       namespace="https://acmesubsidiary.com"
                       use="encoded"/>
      </wsdl:input>
      <wsdl:output name="getWidgetInfoResponse">
        <wsdlsoap:body encodingStyle="https://schemas.xmlsoap.org/soap/encoding/"
                       namespace="https://acme.acmecorp.biz:9999/widget/services"
                       use="encoded"/>
      </wsdl:output>
    </wsdl:operation>
  </wsdl:binding>
  [parts omitted]
In this case, the problem is that the <input> part of <operation> states that the request message (getVersionRequest) is in the namespace "https://acmesubsidiary.com", but the earlier part of the WSDL shows that this message is the target namespace of the web service: "https://acme.acmecorp.biz:9999/widget/services".
Note that an invalid WSDL document can be a valid XML document, so using a pure XML tool to validate the WSDL is not a sufficient test. Some third-party WSDL validation tools are available.
-
The WSDL contains features that are not supported in InterSystems IRIS. For more information, see Consuming WSDLs.
Problems Sending Messages
If you have problems when sending SOAP messages to or from an InterSystems IRIS web service or client, consider this list of common scenarios:
-
The SOAP message might include an extremely long string or binary value, exceeding the string length limit. In this case, InterSystems IRIS throws one of the following errors:
-
A <MAXSTRING> error
-
A datatype validation error (which can have other causes as well):
ERROR #6232: Datatype validation failed for tag your_method_name ...
When generating web client or web service classes, InterSystems IRIS assumes that any string-type input or output can be represented in InterSystems IRIS as %StringOpens in a new tab. Similarly, it assumes that any input or output with XML type base64Binary can be represented in InterSystems IRIS as %xsd.base64BinaryOpens in a new tab). There is no information in a WSDL to inform InterSystems IRIS that this input or output could exceed the string length limit.
See Adjusting the Generated Classes for Extremely Long Strings; this information applies to both web clients and services.
-
-
The web service or client might receive WS-Security headers, but not yet be configured to recognize them. This can result in a generic error like the following:
<ZSOAP>zInvokeClient+269^%SOAP.WebClient.1An error like this can also have other causes. If you receive an error like this, first check whether the messages include WS-Security headers; if so, add the following to the web service or client and recompile it:
Parameter SECURITYIN="REQUIRE";Also, if InterSystems IRIS generated a security policy (in a configuration class), you might need to edit that policy to provide missing details; see Editing the Generated Policy. If you do not do so, you can receive generic errors as given above.
-
The web service or client might require a more specific message form than should be required, according to the SOAP specifications. (This can occur for a service or client that is not in InterSystems IRIS.) InterSystems has encountered the following scenarios, listed here from (approximately) most common to least common:
-
The web service or client requires the message to specify the xsi:type attribute for all elements in the message. To specify use of this attribute, see Controlling Use of the xsi:type Attribute, which applies to both web services and clients.
-
For a null string value, the web service or client requires a null element (rather than omitting the element). To work around this, you can control the form of null string arguments, see Controlling the Form of Null String Arguments, which applies to both web services and clients.
-
The web service or client requires specific namespace prefixes. InterSystems IRIS does not provide a way to specify the namespace prefixes in general.
For the SOAP envelope, however, you can specify the prefix to use. See Specifying the SOAP Envelope Prefix, which applies to both web services and clients.
-
The web client requires the SOAP action to be quoted. To work around this, see Quoting the SOAP Action (SOAP 1.1 Only).
-
The web service or client requires a BOM (byte-order mark) at the start of each SOAP message. The BOM should not be needed because a SOAP message is encoded as UTF-8, which does not have byte order issues. See Adding a Byte-Order Mark to the SOAP Messages, which applies to both web services and clients.
The symptoms of these problems depend upon the third-party product in use.
-
-
The web service or client might not comply with the WSDL. This should not be possible for an InterSystems IRIS web service or client, but can occur in other scenarios. InterSystems has seen the following scenarios:
-
An element in the message is not in the namespace required by the WSDL.
-
The message does not have elements in the same order as the WSDL.
To determine whether the service or client complies with the WSDL, compare the messages to the WSDL.
Or, for a third-party web service, to determine whether the web service complies with the WSDL, it is useful to do the following:
-
Generate a web client using a third-party tool.
-
Send messages from that web client:
-
If this is successful, it is likely that the web service does expect and send messages that are consistent with its WSDL, and the cause of the problem is elsewhere. In this case, compare the messages sent by this client to the messages sent by the InterSystems IRIS client.
-
If this is not successful, it is likely that the web service does not expect or send messages that are consistent with its WSDL.
-
-
-
The web service or client might send messages of a form not supported in InterSystems IRIS. It is useful to examine the WSDL in use and make sure it is supported in InterSystems IRIS; see Consuming WSDLs. Note that these details have changed in InterSystems IRIS over time.