
KPIs and Dashboards
InterSystems has deprecated InterSystems IRIS® Natural Language Processing (NLP). It may be removed from future versions of InterSystems products. The following documentation is provided as reference for existing users only. Existing users who would like assistance identifying an alternative solution should contact the WRCOpens in a new tab.
InterSystems IRIS data platform dashboard technology enables you to create web-based dashboards for your end users. Among other items, dashboards can display KPIs (key performance indicators). In general, a KPI is a query that can be executed and displayed on dashboards; when the dashboard is displayed, the query is executed.
This section describes how to create KPIs based on text analytics and display those KPIs on dashboards.
For information on using text analytics data within cubes, see the Advanced Modeling for InterSystems Business Intelligence.
KPI Terminology
In an InterSystems KPI, each row returned by the query is a separate series of the KPI. The following shows some of the series of a KPI (as seen on the KPI test page, discussed later in this chapter). The series names are shown in the first column of the KPI Values table.
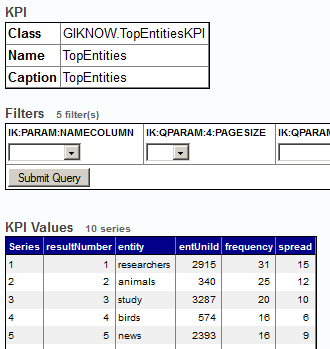
The name of a series (by default), is the value in the first column returned by the query.
A KPI also contains properties, each of which corresponds to a column in the returned data. In the previous example, the KPI has five properties. When you define a KPI, you can override these property names and their order.
The KPI query can include parameters. These are called KPI filters, because they usually (but not always) filter the values returned by the KPI. The KPI test page shows all the available KPI filters. The KPI mechanism automatically provides a set of KPI filters for any KPI.
A KPI can also define actions, which execute custom code. When you add a KPI to a dashboard, you can add controls to the dashboard to execute these actions. For any KPI based on a text analytics query that uses paging, that KPI defines the Previous page and Next page actions.
Defining a KPI That Uses Text Analytics Query
To define a KPI that uses a text analytics query, do the following:
-
Create a class that extends one of the following classes:
-
%iKnow.DeepSee.GenericKPIOpens in a new tab — Use this for most queries. You specify the query in the next step.
-
%iKnow.DeepSee.SourceListFilterKPIOpens in a new tab — Use this to display information about the sources. In this case, the system uses either the GetByEntities() or the GetByDomain() method of %iKnow.Queries.SourceAPIOpens in a new tab.
-
-
In this class, specify the text analytics domain to use. To do so, do either of the following:
-
Specify the integer ID of the domain. To do so, override the IKDOMAINID class parameter and set it equal to the integer ID of the text analytics domain.
-
Specify the cube and NLP (natural language processing) measure that define the domain. To do so, override the following class parameters:
-
IKCUBENAME — Should equal the logical name of a cube.
-
IKMEASURENAME — Should equal the local name of an NLP measure in the given cube.
This technique is possible only if you are using the cube integration. For information on this and defining NLP measures, see the Advanced Modeling for InterSystems Business Intelligence.
-
-
-
Also override the following class parameters, depending on the superclass you used:
-
IKPAGESIZE — Should equal the number of rows to display on any page. The default is 10.
Within dashboards, this affects the number of rows shown per page in a dashboard widget.
-
IKQUERYCLASS — (Only if you subclass %iKnow.DeepSee.GenericKPIOpens in a new tab) Should equal the complete package and class name of the API. Use one of the API classes that belong to the ObjectScript API. For example: %iKnow.Queries.EntityAPIOpens in a new tab
-
IKQUERYNAME — (Only if you subclass %iKnow.DeepSee.GenericKPIOpens in a new tab) Should equal the name of a method in that class.
-
-
Add an XData block like the following to the class; this specifies the logical name and the display name for the KPI:
/// This XData definition defines the KPI.
XData KPI [ XMLNamespace = "http://www.intersystems.com/deepsee/kpi" ]
{
<kpi name="MyKPI" displayName="My KPI">
</kpi>
}
Specify the name and displayName values as needed. Note that name should not include any spaces or punctuation. The value of displayName is localizable. You can omit displayName; by default, name is used.
Also see the later subsection “Overriding the KPI Properties.”
-
Compile the class.
Optionally use the KPI test page. (If you are currently viewing the class in Studio, click View > Web Page.)
To test the KPI, use the drop-down lists in the Filters section. Then click Submit Query.
These drop-down lists include all the available KPI filters; see the next subsection.
Available KPI Filters
The query of the KPI can include parameters; these are called KPI filters, because they usually (but not always) filter the values returned by the KPI. For a KPI based on text analytics, the following KPI filters are automatically available:
-
A meaningful subset of query parameters for the query that you are using (some query parameters, such as the text analytics domain ID, are handled automatically and are not exposed)
-
All public source metadata fields for this domain
-
The NAMECOLUMN parameter, which lets you specify the column to use as the series name
Many of the queries include a filtermode argument that you use to specify the statistical reprocessing to perform after applying a filter; see “Filter Modes,” earlier in this book. When you use such queries directly, the default filtermode is $$$FILTERONLY, which performs no reprocessing.
When you expose such queries as a KPI, the filtermode argument is always specified as $$$FILTERALLANDSORT, so that the frequency and spread statistics are recomputed and the results are re-sorted. Therefore you might see different results when using these queries as KPIs than when using them directly, depending on how you specify filtermode.
Overriding the KPI Properties
By default, any KPI based on %iKnow.DeepSee.GenericKPIOpens in a new tab exposes all result columns in the same order as the query result, with the same names as in the query result. You can modify the order, change names, and hide columns.
Each result column is a KPI property. Users see the following when they create dashboards:
-
When a user adds a pivot table widget based on a KPI, the properties are shown in the same order and with the same names as defined in the KPI, by default.
-
When a user adds a scorecard widget based on a KPI, the user chooses the properties to display. The drop-down list of choices contains the properties in the same order and with the same names as defined in the KPI.
-
In both cases, users can modify the order of the KPI properties and change the titles displayed for them.
To modify the order of the KPI properties, change their names, and hide properties, add a set of <property> elements within the XData block, as follows:
XData KPI [ XMLNamespace = "http://www.intersystems.com/deepsee/kpi" ]
{
<kpi name="MyKPI" displayName="My KPI">
    <property name="entity" displayName="Entity" />
    <property name="frequency" displayName="Frequency" />
    <property name="spread" displayName="Spread" />
</kpi>
}
For <property>, the value for name must exactly match the name of the field returned by the query. For displayName, use the name that should be visible to users. List the <property> elements in the desired order, and list all the properties that should be visible.
Example
The following shows an example KPI:
Class GIKNOW.TopEntitiesKPI Extends %iKnow.DeepSee.GenericKPI
{

Parameter IKDOMAINID = 1;

Parameter IKPAGESIZE As %Integer = 10;

Parameter IKQUERYCLASS = "%iKnow.Queries.EntityAPI";

Parameter IKQUERYNAME = "GetTop";

/// This XData definition defines the KPI.
XData KPI [ XMLNamespace = "http://www.intersystems.com/deepsee/kpi" ]
{
<kpi name="TopEntities" displayName="Top Entities in text analytics domain 1"  >
<property name="resultNumber" displayName="rank"/>
<property name="entity" displayName="entity"/>
<property name="entUniId" displayName="Id"/>
<property name="frequency" displayName="frequency"/>
<property name="spread" displayName="spread"/>
</kpi>
}

}
For another example, see “Example Dashboard with KPI,” in the next section.
Creating a Dashboard to Display the KPI
To make a KPI available to users, you add it to a dashboard. Users can then access the dashboard in various ways; see “Providing Access to Dashboards,” later in this chapter.
Creating Dashboards: Basics
The following instructions briefly explain how to create a simple dashboard that displays a KPI:
-
In the Management Portal, click Analytics > User Portal and then click View.
The system then displays the User Portal, which lists any existing public dashboards and pivot tables in this namespace.
-
Click Menu > New Dashboard.
The system displays a dialog box that prompts you for basic information about the new dashboard.
-
Type a value for Dashboard Name.
-
Optionally specify a value for Folder.
-
For Page Layout, click the third option (no workboxes).
-
Click OK.
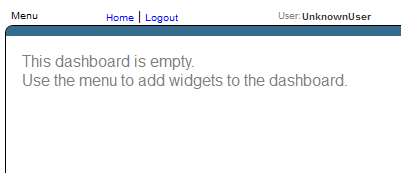
The system creates, saves, and displays the dashboard, which is initially empty.
-
Add a widget to display a KPI. To do so:
-
Click Menu > Add New Widget....
-
In the left area, click an item to show a list of choices.
Select either a pivot table widget or a scorecard.
-
Click the type of the widget to use.
-
On the Data Source tab, click the Search button
 next to Data source.
 -
Click the name of the KPI.
-
Click OK.
-
If you chose a scorecard, see “Configuring the Properties,” later in this section.
-
Click OK to add this widget.
-
-
Resize the widget and click Menu > Save again.
-
For configuration options, see the next subsections.
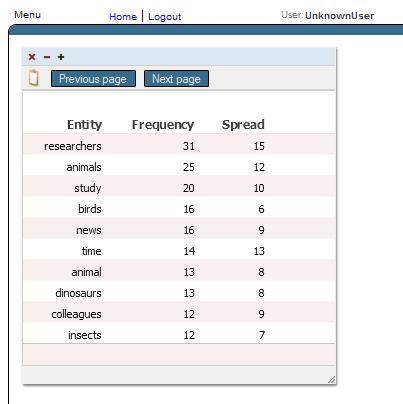
The result might be as follows:
The last section of this chapter provides links to additional information.
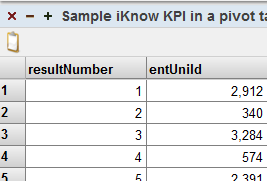
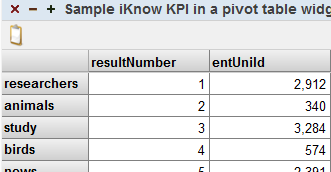
Changing the Series Names
When you display a KPI in a pivot table widget, the series names are used as the names of the rows. By default, the series names are taken from the first column of the returned values, which may not be useful in this scenario. For example, for the following KPI, the first column is the result number:
To choose a different column to use as the series names, do the following:
-
Click the Reconfigure button
 on the widget.
 -
Click the Controls tab.
-
Click the Add button
 to the right of the table, which is initially empty.
 -
For Type, select Hidden.
-
For Action, select Filter.
-
For Filter, select Series name column.
-
For Default Value, click the Add button
. -
Select the name of the column to use (for example, entity for the KPI shown here).
-
Click OK to add the default value.
-
Click OK to add the control.
-
Click OK to complete the widget reconfiguration.
Now the row names have changed. For example:
Configuring the Properties
When you display a KPI in a widget, you may need to reconfigure the properties shown in that widget:
-
For a scorecard widget, you must configure the properties. No columns are shown by default.
-
For a pivot table widget, you might need to configure the properties. All columns are shown by default.
To configure the properties:
-
Click the Reconfigure button
on the widget. -
Click the Data Properties tab.
On this tab, you specify the properties (or columns) of the KPI.
-
To configure a property, click the Add button
. -
For Data Value, select a value from the drop-down list; this lists the result columns of the KPI.
-
Optionally type a caption into Label.
-
Optionally type a format string into Format. By default, numeric values are shown with the thousands separator used in your locale. To format the numbers without the thousands separator, type # into Format.
-
Click OK.
After you have added each result column of the KPI, the dialog box should looks something like this, depending on your KPI:
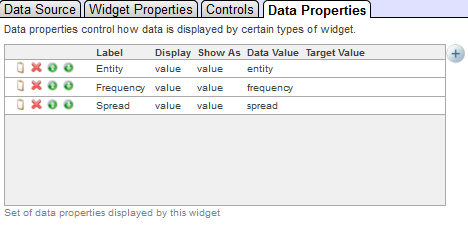
-
Click OK to complete the reconfiguration.
Adding Previous Page and Next Page Buttons
For any KPI based on a query that uses paging, that KPI defines the Previous page and Next page actions. You can configure the widget to include buttons that execute these actions. To do so:
-
Click the Reconfigure button
on the widget. -
Click the Controls tab.
-
Add a Previous Page buttons to this widget, as follows
-
Click the Add button
to the right of the table, which is initially empty.The system displays a dialog box where you specify the control.
-
For Action, select Previous page.
-
For Control Label or Icon, type Previous Page
-
Click OK to add the control.
Use similar steps to add the Next Page button.
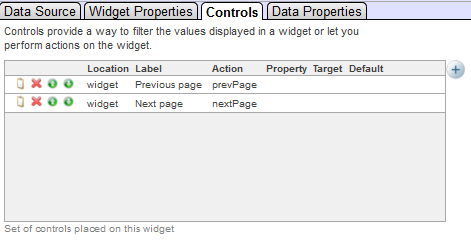
Now the dialog box looks like this:
-
-
Click OK to complete the widget reconfiguration.
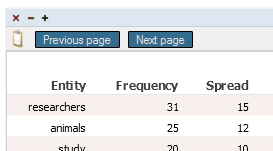
Now the widget includes buttons like this:
Setting Maximum Display Length
When defining a KPI class, you may set a maximum number of rows to display in a dashboard. This can be done by editing the MAXLISTINGROWS parameter in your extension of the generic KPI class. This value must be an integer; if this parameter is undefined in the user class, it will default to 1000.
Example Dashboard with KPI
The SAMPLES namespace provides an example dashboard that displays a KPI that uses text analytics. To see this dashboard:
-
In the Management Portal, access the SAMPLES namespace.
-
Click Analytics > User Portal and then click View.
The system then displays the User Portal, which lists any existing public dashboards and pivot tables in this namespace.
-
Click Aviation event reports.
The system displays the requested dashboard.
In this dashboard, find the widget Top concepts in Event Reports. This widget appears as follows:
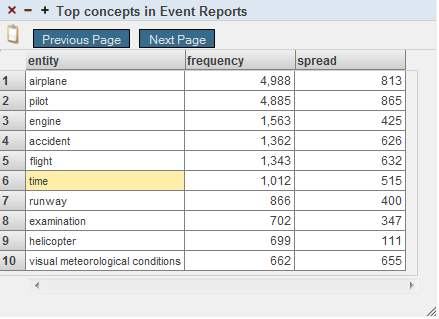
This widget displays the KPI defined in the class Aviation.KPI.TopConcepts.
Providing Access to Dashboards
You can provide dashboards to your users in various ways:
-
Your application can provide direct links to dashboards.
-
You can provide a user portal that has the ability to display dashboards. You can use the InterSystems User Portal or create your own.
The InterSystems User Portal is intended for direct use by end users.
See Also
-
For information on creating dashboards, see Creating Dashboards.
-
For information on accessing dashboards from your application, see “Accessing Dashboards from Your Application” in Implementing InterSystems Business Intelligence.
-
For information on packaging dashboard definitions into classes, see “Packaging Analytics Elements into Classes” in Implementing InterSystems Business Intelligence.
-
For information on the InterSystems User Portal and dashboards, see the Using Dashboards and the User Portal.