Business Intelligence Tutorial: Creating Subject Areas
A Business Intelligence subject area is a subcube with optional overrides to names of items. You define a subject area to enable users to focus on smaller sets of data, for security reasons or other reasons.
Introduction
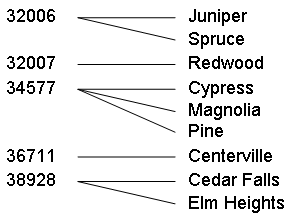
In this tutorial, we create two subject areas that divide the patient data by ZIP code. In the Patients sample, ZIP codes contain small cities as follows:

We will create the following subject areas:
| Subject Area Name | Contents |
|---|---|
| Patient Set A | Patients who live in ZIP codes 32006, 32007, or 36711 |
| Patient Set B | Patients who live in ZIP codes 34577 or 38928 |
Creating the Subject Areas
To create the subject areas, do the following:
-
In the Architect, click New.
-
Click Subject Area.
-
For Subject Area Name, type Patient Set A
-
For Base Cube, click Browse and select Tutorial
-
For Class name for the Subject Area, type Tutorial.SubjectA
-
Click OK.
The system creates the subject area and saves the class.
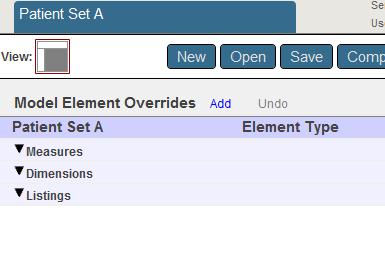
You should see the following:

In the Architect, there is no user interface for defining a filter. Instead it is necessary to type a suitable filter expression or to copy and paste one from the Analyzer.
-
In a separate browser tab or window, access the Analyzer and then do the following:
-
Expand HomeD.
-
Drag and drop ZIP Code to the Filters box in the Pivot Builder area. This adds a filter selection field to the bar directly above the pivot table.
-
In that filter selection field, click the search button and then select 32006, 32007, and 36711.
Click the check mark.
This action filters the pivot table.
Important:Do not drag and drop 32006, 32007, and 36711 separately to the Pivot Builder area’s Filters box. Instead drag the level as described and then select the members.
-
Click the Query Text button
 .
.The system then displays a dialog box that shows the MDX query that the Analyzer is using:
SELECT FROM [Patients] %FILTER %OR({[HOMED].[H1].[ZIP Code].&[32006],[HOMED].[H1].[ZIP Code].&[32007],[HOMED].[H1].[ZIP Code].&[36711]}) -
Copy the text after %FILTER to the system clipboard.
-
Click OK.
-
-
In the Architect, click the line labeled Patient Set A.
-
In the Detail Pane, paste the copied text into Filter.
%OR({[HOMED].[H1].[ZIP Code].&[32006],[HOMED].[H1].[ZIP Code].&[32007],[HOMED].[H1].[ZIP Code].&[36711]}) -
Click Save and then click OK.
-
Compile the subject area.
-
For the second subject area, repeat the preceding steps, with the following changes:
-
For Subject Area Name, type Patient Set B
-
For Class name for the Subject Area, type Tutorial.SubjectB
-
Repeat the preceding steps with the other two ZIP codes. So, for Filter, use the following:
%OR({[HOMED].[H1].[ZIP Code].&[34577],[HOMED].[H1].[ZIP Code].&[38928]})
-
Examining the Subject Areas
Now we examine the subject areas that we have created. The numbers you see will be different from those shown here.
-
In the Analyzer, click the Change button
 .
. -
Click Patient Set A.
-
Click OK.
The Analyzer then displays the contents of the selected subject area.
Notice that the total record count is not as high as it is for your base cube:

-
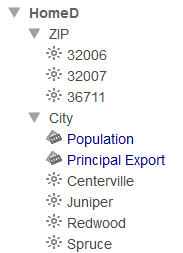
In the Model Contents area, expand the HomeD dimension, ZIP Code level, and City level. You should see the following:

-
Repeat the preceding steps for Patient Set B.
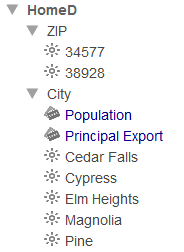
When you expand the HomeD dimension, ZIP Code level, and City level. You should see the following:

Common Filter Expressions
In this section, we experiment with common filters in the Analyzer and see their effect on the generated queries.
-
In the Analyzer, open the Tutorial cube.
The Analyzer refers to both cubes and subject areas as subject areas. The formal distinction between them is relevant only when you are creating them.
-
Click New.
The Analyzer displays Count (a count of the records):

Before we add a filter, let us see how the query is currently defined, so that we have a basis of comparison.
-
Click the Query Text button
 .
.The system then displays a dialog box that shows the MDX query that the Analyzer is using:
SELECT FROM [TUTORIAL] -
Click OK.
-
Expand ColorD and Favorite Color.
-
Drag and drop Orange to Filters.
The Analyzer now uses only patients whose favorite color is orange. It looks something like this:

-
Click the Query Text button
 .
.The system then displays the following query:
SELECT FROM [TUTORIAL] %FILTER [COLORD].[H1].[FAVORITE COLOR].&[ORANGE]The %FILTER keyword restricts the query. The fragment after %FILTER is a filter expression:
[COLORD].[H1].[FAVORITE COLOR].&[ORANGE]This filter expression is a member expression, because it refers to a member (the Orange member of the Favorite Color level). A member is a set of records, and a member expression refers to that set of records.
Notice that this expression uses the dimension, hierarchy, and level names. The &[ORANGE] fragment refers to the key of the Orange member. The Analyzer uses keys rather than names, but you can use either if the member names are unique.
-
Click OK.
-
Add another color to the filter. To do so:
-
Click the X next to Orange in Filters.
This removes that filter.
-
Drag and drop Favorite Color to Filters. This adds a filter box directly above the pivot table.
-
In that filter box, click the search button and then select Orange and Purple.
-
Click the check mark.
This action filters the pivot table.
Important:Do not drag and drop Orange and Purple separately to the Filters box. Instead drag the level as described and then select the members.
The Analyzer now looks something like this:

The system now uses only patients whose favorite color is orange or whose favorite color is purple. (Notice that the count is higher than it was for orange alone.)
-
-
Display the query text again. Now you should see the following:
SELECT FROM [TUTORIAL]
%FILTER %OR({[COLORD].[H1].[FAVORITE COLOR].&[ORANGE],[COLORD].[H1].[FAVORITE COLOR].&[PURPLE]})
In this case, the filter expression is as follows:
%OR({[COLORD].[H1].[FAVORITE COLOR].&[ORANGE],[COLORD].[H1].[FAVORITE COLOR].&[PURPLE]})The %OR function is an InterSystems optimization; the argument to this function is a set.
The set is enclosed by curly braces {} and consists of a comma-separated list of elements. In this case, the set contains two member expressions. A set expression refers to all the records indicated by the elements of the set. In this case, the set refers to all patients whose favorite color is orange and all patients whose favorite color is purple.
-
Click OK.
-
Use the filter drop-down list and clear the check box next to Purple.
Now the Analyzer uses only patients whose favorite color is orange.
-
Expand AllerD and Allergies.
-
Drag and drop mold to Filters, beneath Orange.
The Analyzer now looks something like this:

Notice that the count is lower than we saw using just Orange alone. This pivot table displays only patients whose favorite color is orange and who are allergic to mold.
-
Display the query text again. Now you should see the following:
SELECT FROM [TUTORIAL]
%FILTER NONEMPTYCROSSJOIN([ALLERD].[H1].[ALLERGIES].&[MOLD],[COLORD].[H1].[FAVORITE COLOR].&[ORANGE])
In this case, the filter expression is as follows:
NONEMPTYCROSSJOIN([ALLERD].[H1].[ALLERGIES].&[MOLD],[COLORD].[H1].[FAVORITE COLOR].&[ORANGE])The MDX function NONEMPTYCROSSJOIN combines two members and returns the resulting tuple. The tuple accesses only the records that belong to both of the given members.
Now you have seen the three most common filter expressions:
When you use a member expression as a filter, the system accesses only the records that belong to this member.
You can write a member expression as follows:
[dimension name].[hierarchy name].[level name].&[member key]
Or:
[dimension name].[hierarchy name].[level name].[member name]
Where:
-
dimension name is a dimension name.
-
hierarchy name is a hierarchy name. You can omit the hierarchy name. If you do, the query uses the first level with the given name, as defined in this dimension.
-
level name is the name of a level within that hierarchy. You can omit the level name. If you do, the query uses the first member with the given name, as defined within this dimension.
-
member key is the key of a member within the given level. This is often the same as the member name.
-
member name is the name of a member within the given level.
When you use a set of members as a filter, the system accesses the records that belong to any of the given members. That is, the members are combined with logical OR.
You can write a set expression that refers to members as follows:
{member_expression,member_expression,member_expression...}
Where member_expression is a member expression.
When you use a tuple as a filter, the system accesses the records that belong to all of the given members. That is, the members are combined with logical AND.
You can write a tuple expression as follows:
NONEMPTYCROSSJOIN(member_expression,member_expression)
Or:
(member_expression,member_expression)
For additional variations, see Using InterSystems MDX and InterSystems MDX Reference.