
Configuring Settings
This page describes how to configure options that affect the appearance and behavior of InterSystems IRIS® data platform Business Intelligence, as part of the implementation process.
Accessing the Business Intelligence Settings
To access the Business Intelligence settings:
-
Click the InterSystems Launcher and then click Management Portal.
Depending on your security, you may be prompted to log in with an InterSystems IRIS® username and password.
-
Switch to the appropriate namespace as follows:
-
Click the current namespace name to open the list of available namespaces.
-
From the list, click the appropriate namespace.
-
-
Click Analytics > Admin > Settings.
The system displays the following page:
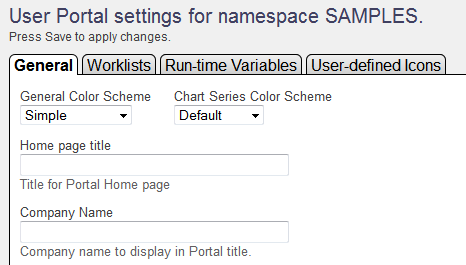
Specifying Basic Settings
On the General tab, you can specify the following settings:
-
General Color Scheme — Select a color scheme for the User Portal.
-
Chart Series Color Scheme — Select a color scheme for chart series. This is used as the default color scheme. Via the Dashboard Editor, users can apply a different color scheme to a given chart.
-
Home Page Title — Specify the title for the browser page or tab.
-
Company Name — Select a title to display in the upper right area of the User Portal.
If you specify this, do not specify Company Logo.
-
Company Logo — Specify the URL of an image to display to the right of the company name.
Specify either a complete URL, starting with http:// or a URL relative to the web application defined for this namespace.
If you specify this, Company Name is ignored.
-
Company Link — Specify the URL to open when a user clicks the company logo or name in the upper right.
Specify either a complete URL, starting with http:// or a URL relative to the web application defined for this namespace.
-
Google Maps API Key — Specify a key to use for the Google Maps API. Google has changed their policy regarding the use of the Google Maps libraries so that all new installations require an API key to function. See the Google Maps API DocumentationOpens in a new tab for more information.
-
Dashboard email — See the next topic.
-
Default Resource — Default resource to use to secure pivot tables and dashboards.
-
No Dashboard Titles — If this option is selected, the system hides the title area in the User Portal and in all dashboards. The title area is this area:

This option is equivalent to the NOTITLE URL parameter; see Available URL Parameters.
-
No Dashboard Borders — If this option is selected, the system hides the border in the User Portal and in all dashboards. This option is equivalent to the NOBORDER URL parameter; see Available URL Parameters.
-
Show Calculated Members in Filters — If this option is selected, calculated members that are part of existing cube dimensions will appear in filters. This setting does not affect calculated members that are part of special dimensions created by the definition of a calculated member.
-
Autosave — These options enable or disable the autosave feature in this namespace. If the Analyzer check box is selected, the system automatically saves the state of the Analyzer for each user, for each pivot table. This means that when a given user opens a pivot table in the Analyzer, the system displays that pivot table as the user last saw it.
Similarly, if the User Portal Settings check box is selected, the system automatically saves the state of the User Portal for each user, for each dashboard.
In both the Analyzer and the User Portal, there is an option to clear the autosave state. (You can also remove all autosave data programmatically. See the %KillAutosaveFolders() method of %DeepSee.UserLibrary.UtilsOpens in a new tab.)
Click Save after making any changes on this tab.
Configuring Business Intelligence to Support Email
On the General tab, you can configure Business Intelligence so that users can send email from within dashboards. To do so, use the Dashboard email setting. Select one of the following:
-
Use client-side email — Enables email in Business Intelligence. When a user sends email, the system accesses the default client-side email system, which the user then uses to send a message. The message contains a link to the dashboard, and the user can edit the message.
-
Use server-side email — Enables email in Business Intelligence. When a user sends email, the system displays a dialog box where the user types the email address and enters an optional comment, which the system adds to the message that it generates; this default message contains a link to the dashboard. The system then sends the email via an SMTP server.
If you select this, you must also configure InterSystems IRIS to use an SMTP server. See Configuring Task Manager Email Settings.
-
Disabled — Disables support for email within Business Intelligence.
This is the default.
Customizing Worklists
On the Worklists tab, you can customize how the system displays worklists. To do so, click Customized worklists and then select options in the following groups:
-
The Home Page Top Panel and Home Page Bottom Panel options specify the worklists that are available in the User Portal, which always has two worklist areas on the left.
-
The Dashboard Page Top Panel and Dashboard Page Bottom Panel options specify the worklists that are available in dashboards, which can have zero, one, or two worklist areas on the left, depending on their configuration.
In each section of this page, select the worklists to be available in the corresponding area. The available worklists are as follows:
-
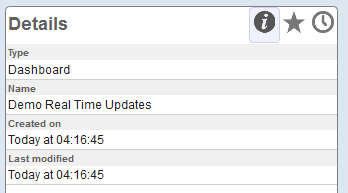
The Details worklist displays details for the pivot table or dashboard that the user has selected. For example:
-
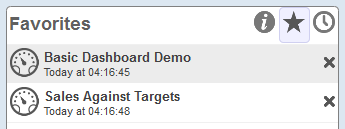
The Favorites worklist displays any items that the user has marked as favorites. For example:
-
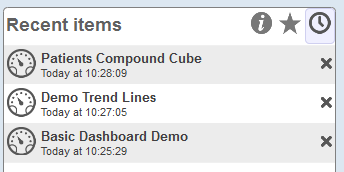
The Recent items worklist displays items that the user has recently accessed. For example:
-
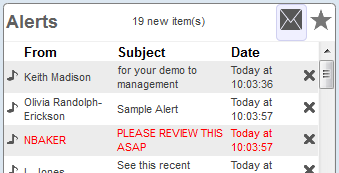
The Alerts worklist displays recent alerts for the user. For example:
-
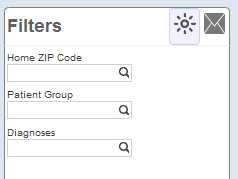
The Filters worklist displays filters and other controls in the dashboard. For example:
Creating Runtime Variables for Use as Default Values for Filters
On the Run-time Variables tab, you can define variables that have a logical name and a value that is an ObjectScript expression that is evaluated at runtime. You use these within dashboards for the default values of filters.
To add a setting:
-
Click New.
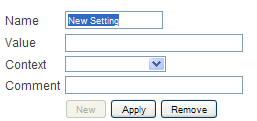
The page then displays the following:
-
Specify the following details:
-
Name — Specify the name of the variable.
-
Value — Specify an ObjectScript expression.
The value can be any valid ObjectScript expression. For example, it can be an invocation of a class method or routine; that method or routine can use special variables such as $USERNAME and $ROLES.
For details on the allowed values, see the section Allowed Default Values for Filters.
-
Context — Select DefaultFilterValue to specify the context in which you will use this expression. Then the Widget Editor lists this setting as a possible default value for a filter, when you add a control to a widget.
The value Other is currently not used.
-
Description — Optionally specify a comment.
-
-
Click Apply.
The variable is added to the table, which also shows its current value:

Editing Runtime Variables
To edit a runtime variable:
-
Click the variable in the table.
-
Edit the details in the area below the table.
-
Click Apply.
Removing Runtime Variables
To remove a runtime variable, click the X in the row for that variable.
The system immediately removes the variable.
Allowed Default Values for Filters
The following table lists the possible default values for filters, when used with an MDX-based data source. Use this information when you define runtime variables to use as filter defaults, or when you specify filters in other ways described in this documentation.
| Scenario | Expression That Returns This Value |
|---|---|
| A single member | "&[keyval]" where keyval is the key for the member. See Key Values. |
| A range of members | "&[keyval1]:&[keyval2]" |
| A set of members | "{&[keyval1],&[keyval2],&[keyval3]}" |
| All members of the level except for a specified single member | "%NOT &[keyval]" |
| All members of the level except for a specified subset | "%NOT{&[keyval1],&[keyval2],&[keyval3]}" |
Note that for an MDX-based data source, the filter name and filter value are not case-sensitive (except for the optional %NOT string).
Creating Icons
On the User-defined Icons tab, you can define reusable icons with logical names. You can use these icons within pivot tables that have conditional formatting and within widget controls on dashboards.
To add an icon:
-
Click New.
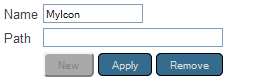
The bottom area of the page then displays the following:
-
For Name, specify the name you will use to refer to this icon.
-
For Path, specify the location of the icon file. Do one of the following:
-
Specify a relative path that is relative to install-dir/CSP/broker/
-
Specify a complete URL.
-
-
Click Apply.
The icon is added to the table, which also shows a preview.
You can edit or remove icons in the same way that you do with runtime variables. See the previous section for details.
For information on using icons in pivot tables with conditional formatting, see Applying Conditional Formatting. For information on configuring widget controls, see Adding a Control.
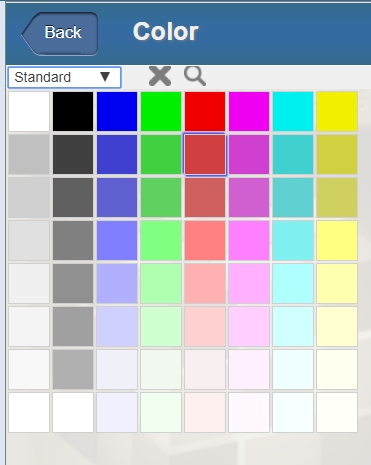
Creating Custom Color Palettes
You can also create custom color palettes, for use in the dashboard editor, which provides a color picker. The following shows this color picker with one of the default color palettes:
To add a custom color palette, add nodes to the ^DeepSee.UserPortalColorSets global, as follows:
| Node | Value |
|---|---|
| ^DeepSee.UserPortalColorSets(n) where n is an integer, incremented from the previous node in the global. | A $LISTBUILD list that consists of the following items, in order:
|
For example:
 set colorlist = "darkturquoise;greenyellow;hotpink;floralwhite;palevioletred;plum;"
 set colorlist = colorlist _"powderblue;palegreen;plum;mediumaquamarine;linen;"
 set colorlist = colorlist _"lightsteelblue;lightpink;oldlace;lightsalmon;gold;"
 set mycolors=$LB("My Custom Colors","My Custom Colors",colorlist)
 set ^DeepSee.UserPortalColorSets($I(^DeepSee.UserPortalColorSets)) = mycolors
When a user selects a color palette, the system displays a sample of each color in the grid. You can specify up to 64 colors.