
Creating Pivot Tables
This page presents basic information on creating pivot tables in Business Intelligence.
Also see Accessing the BI Samples.
Introduction to the Autosave Feature
InterSystems IRIS® data platform Business Intelligence provides an optional autosave feature, which can automatically save the state of the Analyzer for each user, for each pivot table. If the autosave feature is enabled for the Analyzer:
-
When you access the Analyzer, the system displays that user interface as you last saw it.
-
When you display a pivot table in the Analyzer, the system displays that pivot table as you last saw it.
For information on this option, see Specifying Basic Settings. Note that there is a separate autosave feature for the User Portal.
Selecting a Subject Area
A subject area provides the elements that you use as the basis of any pivot table. To select the subject area to use:
-
Click the Change button
 or click the Select Subject Area link.
 -
Click the name of the subject area.
-
Click OK.
Getting Familiar with a Subject Area
The Model Contents area lists the contents of the subject area that you are currently viewing. For example, this area might look like this initially:
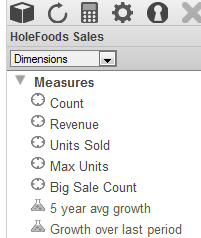
If you have not worked with the current subject area before, it is useful to examine its contents. First, use the drop-down list to select the kind of item to display in this area. Select one of the following:
-
Dimensions — Select this to display the basic model defined in this subject area. In this case, the Model Viewer can display the following sections:
-
Pivots — Select this to display any pivot tables defined in this subject area.
-
Quality Measures — Select this to display any quality measures available in this subject area.
-
Detail Listings — Select this to display any detail listings defined in this subject area.
The purpose of the Model Content area is to enable you to create pivot tables. To do this, drag and drop items into the Pivot Builder area on the right, as described in the next section.
For most items, if you hover the cursor over the name of an item in the Model Content area, the system displays a tooltip that shows the description of the item, if any.
Measures
To display a list of measures, select Dimensions from the drop-down list in the Model Contents area. Then expand the Measures folder. This folder lists all measures in the subject area. For example:

You can have two types of measures, indicated by icons as follows:
| Standard measures | |
| Calculated measures, which are defined in terms of other measures |
Dimensions
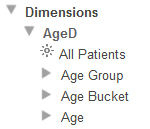
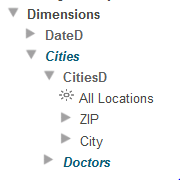
To display a list of dimensions, select Dimensions from the drop-down list in the Model Contents area. Then expand the Dimensions folder. This folder lists the dimensions and the levels, members, and properties that they contain; it might also list related subject areas, with their dimensions, levels, and so on.
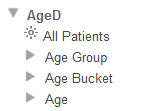
Click the triangle next to any dimension name to expand it. A dimension contains at least one level and may also include a special member known as the All member. In the following example, the AgeD dimension includes an All member named All Patients, as well as the levels Age Group, Age Bucket, and Age.
Hierarchies
Each dimension also includes at least one hierarchy, which is the actual container for levels. The following shows an example (a modified version of the Patients subject area), with a hierarchy named H1.
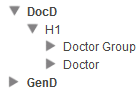
By default, hierarchy names are not shown unless a dimension contains multiple hierarchies. Alternatively, a dimension can be defined so that its hierarchy names are always or never shown.
In the Patients subject area, each dimension contains only one hierarchy, so the hierarchy names are not shown. Hierarchies are purely informational; you cannot drag and drop them as you can with the other items in the Model Contents pane.
Level Members and Properties
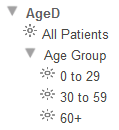
If you expand a level, the list displays the members of that level. For example:
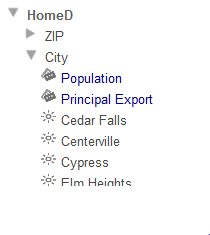
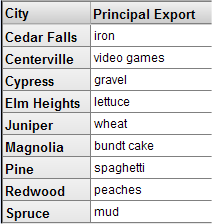
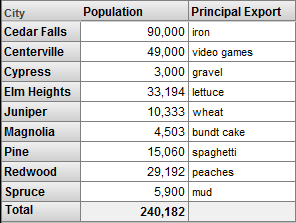
If a level also includes properties, this area shows the property names with a different icon. For example, the City level includes the Population and Principal Export properties:
Variations for Data Levels with Many Members
If a data level contains more than 500 members but fewer than 10,000 members, this area displays any property names, followed by subfolders that contain the members in groups of 100. For example:
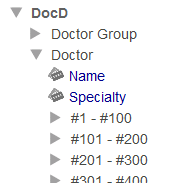
In this case, the system does not access the member names until you expand one of these subfolders. Thus it is possible to see and use the properties without waiting for the system to access all the member names.
If a level contains 10,000 members or more, this area displays only the property names, if any, of the level.
The preceding discussion applies only to data levels. In contrast, time levels are always displayed in the same way.
Related Subject Areas
The Dimensions folder might also list related subject areas, which it shows in bold italics. If you expand a related subject area, you can access the dimensions, levels, and possibly the hierarchies of the other subject area, as follows:
Pivot Variables
To display a list of pivot variables, select Dimensions from the drop-down list in the Model Contents area. Then expand the Pivot Variables folder. This folder (if included) lists any pivot variables in the subject area. For example:
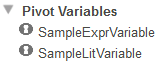
Unlike most other elements in the Dimensions section, pivot variables are defined in the Analyzer; see Defining and Using Pivot Variables.
Plug-ins
To display a list of plug-ins, select Dimensions from the drop-down list in the Model Contents area. Then expand the Plug-ins folder. This folder (if included) lists any plugins in the subject area. For example:
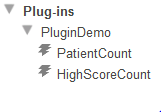
A plug-in contains one or more properties, each of which computes a value. This particular plug-in contains two properties. Plug-in properties can be used in the same way as measures.
Named Sets
To display a list of named sets, select Dimensions from the drop-down list in the Model Contents area. Then expand the Named Sets folder. This folder (if included) lists any named sets in the subject area. For example:
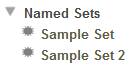
A set contains one or more items; typically each item is a member of a level defined elsewhere.
Named Filters
To display a list of named filters, select Dimensions from the drop-down list in the Model Contents area. Then expand the Named Filters folder. This folder (if included) lists any named filters in the subject area. For example:
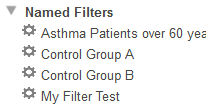
Unlike most other elements in the Dimensions section, named filters are defined in the Analyzer; see Defining Named Filters.
Calculated Members
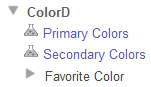
At the bottom of the Dimensions section, the Model Contents pane shows any special dimensions that contain calculated members. These special dimensions include only members, not hierarchies or levels. For example:
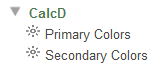
Calculated members are typically combinations of other members. For example, the Primary Colors member is a combination of the Red, Yellow, and Blue members of the Favorite Color level.
Other dimensions in your model might also include calculated members. If so, the member is displayed in that dimension with a different icon than other members. For example, if we redefined the two calculated members to move them to the ColorD dimension, we would see the following for that dimension:
Unlike most other elements in the Dimensions section, calculated members can be defined in the Analyzer; see Defining Calculated Elements.
Pivot Tables
To display a list of pivot tables, select Pivots from the drop-down list in the Model Contents area. Then expand the Pivots folder. This folder (if included) lists any pivot tables defined in the subject area. For example:
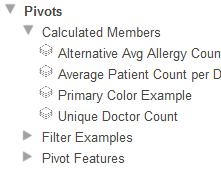
To use this area, expand folders and needed and click a pivot table name. The Pivot Preview area then displays that pivot table.
Quality Measures
To display a list of quality measures, select Quality Measures from the drop-down list in the Model Contents area. Then expand the Quality Measures folder. This folder (if included) lists any quality measures in the subject area. For example:
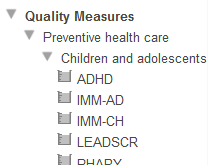
Quality measures can be used in the same way as measures.
Detail Listings
To display a list of detail listings, select Detail Listings from the drop-down list in the Model Contents area. This area then lists any detail listings defined in the subject area. For example:
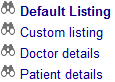
For information on using this area, see Displaying a Detail Listing.
Creating a Pivot Table
To create a pivot table:
-
Click New.
-
In the Model Contents pane, select either Dimensions or Quality Measures.
-
Drag and drop items from the Model Contents pane to the Pivot Builder area, as described in the rest of this page.
For example:
-
Expand DiagD in the Model Contents pane.
-
Drag and drop Diagnoses to Rows.
Or double-click Diagnoses.
Or click Diagnoses and then click the plus sign in the header of the Rows box.
-
Drag and drop Patient Count to Measures.
Or double-click this measure.
Or click Patient Count and then click the plus sign in the header of the Measures box.
-
Drag and drop Avg Allergy Count to Measures.
-
Expand AgeD in the Model Contents pane.
-
Drag and drop All Patients to Rows, below Diagnoses.
-
-
Repeat steps 2 and 3 as necessary.
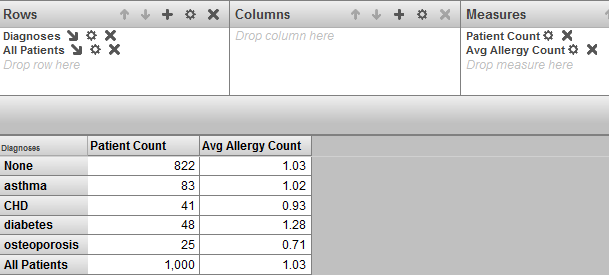
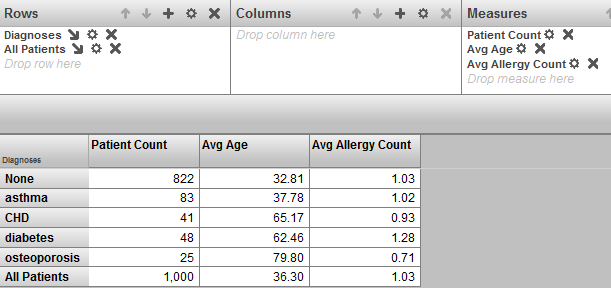
Each time you make a change, the Analyzer reruns the pivot table and shows the results in the Pivot Preview area. For the preceding steps, the final result might be as follows (depending on the values in your data):
-
Click Save.
The system displays a dialog box where you specify the pivot table name.
-
For Pivot Name, specify the name of the pivot table.
Also see Preparing for Folder Item Localization.
Note that this complete string is used (along with Folder) as the logical name of the pivot table; the system displays this logical name when you use the Save As option, for example.
-
Optionally specify other values as follows:
-
Folder — Type a folder name or select an existing folder.
Also see Preparing for Folder Item Localization.
Note that if you specify a folder name that starts with a single dollar sign, the pivot table definition is accessible only in your IDEOpens in a new tab.
-
Public — Specifies whether this pivot table is displayed in the User Portal main area.
Important:This option does not control access to the pivot table. Access is controlled instead by the Pivot Owner and Access Resource options, discussed later in this list.
Note that even if the pivot table is not marked as public, you can access it in the Analyzer via Open. Also, you can find it in the User Portal by using the Find option. See Introduction to the User Portal.
-
Locked — Select this check box to temporarily prevent changes to this pivot table. If you select this option, you must clear the Locked check box before any changes can be made to it.
-
Pivot Owner — Optionally specifies the InterSystems IRIS® data platform user who owns this pivot table. If a pivot table has an owner, then only the owner can specify the Access Resource value for the pivot table; see the next item.
-
Access Resource — Optionally specifies the resource that is used to control access to this pivot table. If you specify this, also specify Pivot Owner.
-
Description — Type a description for this pivot table.
-
Keywords — Type keywords to categorize this pivot table, one keyword (or phrase) per line.
These keywords are displayed in the User Portal in List View.
-
Category — Specify the category to which this item belongs.
Categories control how the items are grouped in the User Portal in Covers View.
-
-
Click OK.
Specifying the Rows in a Pivot Table
To specify the rows of a pivot table, you drag and drop items of various types from the Model Contents pane into different areas of the Rows box. This section discusses, with samples, the items that can be used as rows, and provides details of how to specify the rows.
Items That Can Be Used in the Rows Box
You can use any combination of the following items in the Rows box:
-
Levels. This is the most common scenario. When you drag and drop a level to Rows, the query creates a set of all the members of that level, and uses those members for rows. For example:
Rows Pivot Table Allergies level 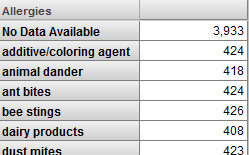
-
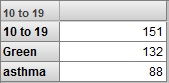
Members, including calculated members. You can drag and drop individual members to Rows. For example:
Rows Pivot Table 10 to 19 member of Age Bucket level Green member of Favorite Color level
asthma member of Allergies level
 Important:
To drag and drop a member, you must click the member name rather than the icon to its left.
Note that you can hide the row caption; see Specifying Pivot Options. This option is especially useful when you drag and drop individual members, because the name of the first member is also used as the caption for the rows, and this is not usually a suitable caption.
-
Dimensions, including calculated dimensions. If you drag and drop a dimension to Rows, the query uses all members of the first level of the first hierarchy of that dimension. For example:
Rows Pivot Table AgeD dimension 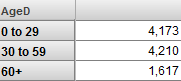
-
Named sets. If you drag and drop a named set to Rows, the query uses each item in that set as a separate row. For example:
Rows Pivot Table Sample Set 2 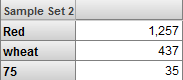
-
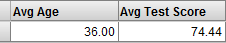
Measures. If you drag and drop a measure to Rows, the system uses that measure as a row. For example:
Rows Pivot Table Avg Age measure Avg Allergy Count measure
Avg Test Score measure
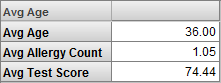
If there is only one column (as in the case shown here), the data shown for the measure is the aggregate value for that measure across all records (or across all included records, if the pivot table is filtered).
If the pivot table includes multiple columns corresponding to members, then the data in any column is the value for that measure for that member.
If the pivot table includes columns that correspond to measures, the column definition takes precedence and the value shown is determined by the measure used in the column.
Note that you can hide the row caption; see Specifying Pivot Options. This option is especially useful when you drag and drop measures to Rows, because the name of the first measure is also used as the caption for the rows, and this is not usually a suitable caption.
-
Level properties. See Displaying Properties in a Pivot Table.
-
Pivot variables. See Defining and Using Expression Pivot Variables.
-
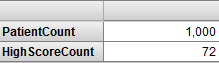
Plugins. For example:
Rows Pivot Table PatientCount plug-in property HighScoreCount plug-in property
You can also double-click a level, dimension, member, or named set in the Model Contents pane. If you do, the system removes any items currently in Rows and replaces them with what you double-clicked.
If hierarchies are displayed in the Model Contents pane, they are for informational purposes only; you cannot drag and drop them.
Specifying the Rows
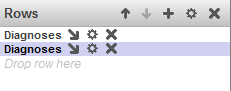
To specify the rows in the pivot table, drag and drop items from the Model Contents pane to the Drop row here label in the Rows box. When you do so, the Rows box looks like this:
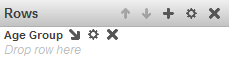
Now there are three places into which you can drag and drop additional items:
-
If you drag and drop onto the bold item label (Age Group in this case), the Analyzer replaces the existing item with the new one.
-
If you drag and drop onto Drop row here, the Analyzer adds additional rows to the table. For example:
Rows Pivot Table 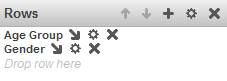
Note that you can hide the row caption; see Specifying Pivot Options.
-
If you drag and drop onto the Add Breakout button
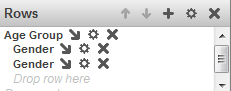
 after the bold item label, the Analyzer subdivides the existing rows. For example:
Rows Pivot Table 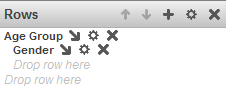
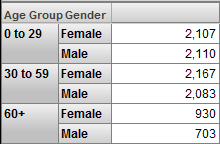
Notice that now there are two labels called Drop row here. The non-indented one affects the outermost grouping. The indented one affects the inner grouping.
When you nest levels this way, the system initially returns only the first 2,000 combinations of the levels. If there are more than 2,000 rows, the system displays the Show All button at the bottom of the pivot preview area. If you click this button, the system returns all the combinations, and you can page through them.
To remove an item from the rows, click the X button to the right of its label in the Rows box.
For information on the Advanced Options button  , see Customizing Pivot Table Items.
Specifying the Columns in a Pivot Table
The columns of a pivot table are controlled by Measures and Columns:
-
For the Columns box, you can drag and drop any of the items that you can use for Rows. See the preceding section for information on the items and details on the options.
-
You can drag and drop only measures from the Model Contents pane to Measures.
Measures are always used as the innermost grouping. For example, consider the following pivot table configuration:
This pivot table looks as follows:
The system does not display more than 100 columns.
Displaying Measures in a Pivot Table
By default, the Analyzer displays the count of lowest-level records. For example:
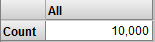
Within the body of the pivot table, you can instead display one or more measures, quality measures, or plug-in properties, in any combination. Note that you can use measures, quality measures, and plug-in properties (usually referred to as plug-ins) interchangeably. This section uses the generic term measures to refer to all of these items.
To display a measure as a column, drag and drop it into the Measures box or the Columns box. For example:
| Measures | Pivot Table |
|---|---|
|
Avg Age measure Avg Test Score measure |
 |
Or double-click the measure in the Model Contents pane.
Or drag and drop a measure to the Rows box, as discussed earlier. Note that if you display a measure as a row and another measure as a column, the system displays only the value of the measure that is used as a column.
The following subsections discuss additional topics:
Pivot Tables with One Measure
To display measures as columns, you can drag and drop them to the Measures box or to the Columns box. If the pivot table has multiple measures, the resulting pivot table (and underlying MDX query) is identical with either technique. If the pivot table has only a single measure, however, the two techniques generate slightly different MDX queries:
| Technique | Comments |
|---|---|
| Drag and drop the measure to the Measures box | The underlying MDX query uses the measure in its filter clause. This means that this pivot table cannot be displayed in a scorecard (on a dashboard). |
| Drag and drop the measure to the Columns box | The underlying MDX query uses the measure as a column. This pivot table can be displayed in a scorecard. |
Pivot Tables with Multiple Measures
If you drag and drop multiple measures to the Measures box, you can specify whether the measures are used as columns (as in the default case) or as rows. To do so, click the Options button in the Measures box. The system displays a dialog box; for this discussion, use the options in the section Place measures on. Choose one of the following:
-
Rows — Displays the measures as rows.
-
Columns — Displays the measures as columns.
Then click OK.
This option makes it easier to redefine complex pivot tables, because you can rearrange the Rows box or Columns box and leave the measures alone.
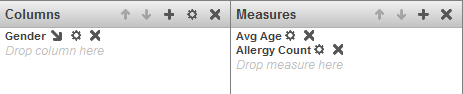
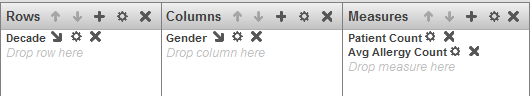
For example, consider the following pivot table definition:
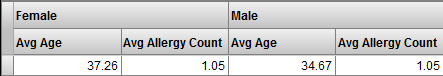
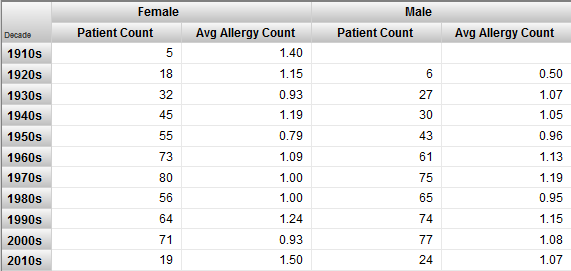
By default, the measures are used as columns (nested within the elements listed in the Columns box), as in the following example:
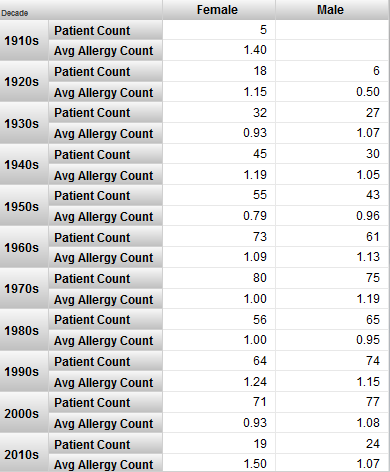
If you instead use the option to display the measures as rows, the pivot table looks like this:
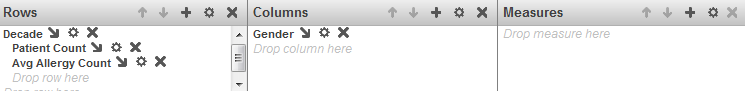
This pivot table is equivalent to one defined as follows:
Controlling the Display of the Measure Headings
By default, when a pivot table displays a level on columns and displays measures, the pivot table may or may not include a heading for the measures, as follows:
-
If the pivot table has only one measure, the measure name is not shown. For example:
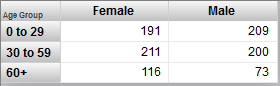
-
If the pivot table has multiple measures, the measure names are shown. For example:
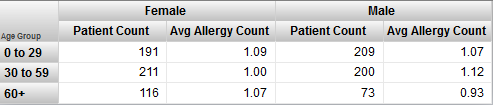
You can control this behavior. To do so, click the Options button in the Measures box. The system displays a dialog box; for this discussion, use the options in the section Display measure headers. Choose one of the following options:
-
If More Than 1 Measure — The system displays the measure name if there is more than one measure, but does not display the name if there is only one measure.
-
Always — The system always displays the measure name.
-
Never — The system never displays the measure name.
These options apply only when the pivot table also displays another item on columns, as in the examples shown here.
Displaying Properties in a Pivot Table
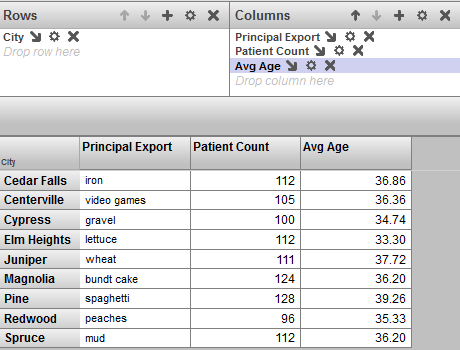
You can display the properties of a level if you are also using that level as rows or columns. For example, if you display City as rows, you can display Principal Export as a column by dragging the property to the Columns box:
If you display City as columns, you can display Principal Export as a row:

Displaying Both Properties and Measures
If you display a property as a column and you want to display a measure as another column, you must drag and drop the measure to Columns rather than to Measures. For example:
Transposing a Pivot Table
You can transpose a pivot table; that is, switch its rows and columns. To do so, click the Transpose button  .
.
Changing the Order of Items
To change the order of items listed within the Rows, Columns, Measures, or Filters box:
-
Click an item within that box. When you do so, the system enables the applicable buttons in the header of the box.
-
Click the up or down arrows as appropriate.
Copying and Pasting Items
To copy and paste items within the Rows, Columns, Measures, or Filters box:
-
Click an item within that box. Now it is shown with a highlight.
-
Click the Copy button
 in the top area.
 -
Click the destination for this item. Either click another box or click an item in a box.
-
Click one of the paste buttons:
-
Click
 to paste the item within the box or after to the selected item.
 -
Click
 to paste the item as a breakout within the selected item.
-
Adding a Summary Row or Column
You can add a summary row, summary column, or both. This section describes the following approaches:
Adding a Summary Row or Column as a Pivot Option
To add a summary row, summary column, or both:
-
Click the Pivot Options button
 .
.The Analyzer displays the Pivot Options page, which is discussed in detail later in this book.
This procedure discusses only the Summary option.
-
Click the Summary check box.
-
Select a summary option from the drop-down list. The options are as follows:
-
Sum — Displays the sum of the values.
-
Count — Displays the count of rows.
-
Max — Displays the maximum of the values.
-
Min — Displays the minimum of the values.
-
Average — Displays the average of the values.
-
% of Total — Displays the sum of the values of this column (or row), as a percentage of the sums of all columns (or rows).
For information on overriding how the summary is computed for a given measure, see Specifying Alternative Aggregation Methods for a Measure.
-
-
(For summary rows only) Optionally, to cause the summary row to summarize all rows (including rows on later pages), select All Rows from the second drop-down list.
For example, the following pivot table includes a total row. Notice that it displays the total only for numeric values:
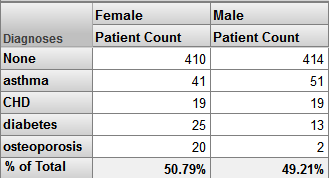
The following example shows % of Total, which is useful primarily when you use a level in Columns:
In contrast to the other forms of summaries, note the following:
-
If you display the pivot table as a chart, the chart does not include the summary row or column.
-
If you export to Excel, the summary is included only if it is a sum.
Adding the All Member as a Summary Row or Column
Your cube may include one or more All members. Each dimension can contain a All member, which is listed within the dimension, in the Model Contents pane, before any levels. For example:
An All member represents all records and is typically named something like All Ages or All Categories. Or, as in the example shown here, the All member might have a truly generic name.
You can drag and drop this member to Rows or Columns to add it as a summary row or column. For example:
In contrast to using the pivot options, this approach allows each measure to be aggregated in a different manner. The Patient Count measure is summed, and the Avg Age and Avg Allergy Count measures are averaged.
If you do not have any All members, you can add a custom aggregation.
Adding a Summary Row or Column as a Custom Aggregation
This section describes how to add a summary row as a custom aggregation. The technique is easily adapted for a summary column.
-
For the level used as the rows, add the same level again to the Rows box.
-
Click the Advanced Options button
next to the second level in Rows.The Analyzer displays the Advanced Options page, which is discussed in detail later in this book.
-
Select Compute Aggregate and then select an aggregation function. You can use any of the following functions:
-
SUM — For each displayed measure, display the sum of the values of the members.
-
AVG — For each displayed measure, display the average of the values of the members.
-
MIN — For each displayed measure, display the minimum of the values of the members.
-
MAX — For each displayed measure, display the maximum of the values of the members.
-
COUNT — For each displayed measure, display the count of the members.
-
COUNT NONEMPTY — For each displayed measure, display the count of the members that have values in the current context.
-
AGGREGATE — For each displayed measure, display the aggregate value of the members, using the aggregation method defined for that measure.
-
MEDIAN — For each displayed measure, display the median of the values of the members.
-
STDDEV — For each displayed measure, display the standard deviation of the values of the members.
-
VARIANCE — For each displayed measure, display the variance of the values of the members.
-
PERCENTILE — For the given percentile value and for each displayed measure, display the measure value that is at that percentile value.
For this option, you can specify a percentile value in the Percentile field; the default is 50.
-
-
Optionally type a new caption into Caption. The default caption is the name of the function.
When you use this option, the system first uses any other settings you specified on this dialog box.
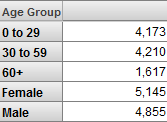
For example, consider the following pivot table:
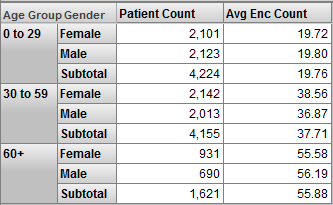
This pivot table is defined with the following items in Rows:
The second Gender item uses the following options:
-
Compute Aggregate is Aggregate
-
Caption is Subtotal
Applying 80/20 Suppression
The Analyzer provides an easy way to display the top 80% of a set (considering the count measure by default), and to group the bottom 20% into a single unit, as in the following example.
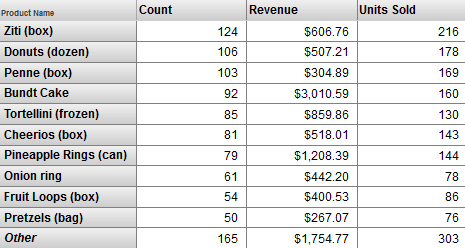
This example demonstrates the 80/20 suppression option used for rows. The option is also available for columns. To use this option:
-
Click the Advanced Options button
in the Rows or Columns box. -
Optionally click Sort Members.
Then select a measure and select Ascending or Descending.
By default, the 80/20 suppression option first sorts the members in descending order by count. Use Sort Members to specify a different sort order.
-
Select Apply 80/20 Suppression.
-
Click OK.
To modify the query to use different percentages, see the section Modifying Details of the 80/20 Suppression Option.
Clearing the Autosave State of a Pivot Table
If the autosave feature for the Analyzer is enabled, then when you display a pivot table, the Analyzer displays that pivot table with any unsaved changes that you might have made in the Analyzer. To remove these unsaved changes, click Restore. Then the Analyzer displays the pivot table as defined in its saved definition.
Or save the pivot table, thus saving the changes and changing the definition. See the next topic.
Saving a Pivot Table
To save a pivot table, do one of the following:
-
Click Save. The Analyzer saves the pivot table immediately, if you have specified a name for it; otherwise, the Analyzer prompts you as if you had selected Menu > Save With Options.
-
Click Menu > Save. The Analyzer saves the pivot table immediately, if you have specified a name for it; otherwise, the Analyzer prompts you as if you had selected Menu > Save With Options.
-
Click Menu > Save With Options. The Analyzer displays a dialog box with the same options that are available for a new pivot table; see Creating a Pivot Table.
If you specify a new folder or a new name, the Analyzer creates a copy of the original pivot table and saves it to this new name.
Then click OK.
If the pivot table already exists, the system prompts you for confirmation that you want to overwrite it.
Or click Save As to make a copy of the pivot table. The Analyzer prompts you for a new name.
To check whether or not a pivot table has unsaved changes, check its name in the upper left corner of the Analyzer banner. An asterisk by the pivot table name indicates unsaved changes, and will disappear after saving.