
Adding Other Widgets
This page describes how to add other kinds of widgets to a Business Intelligence dashboard.
The Dashboard Editor also provides the Worksheet option, which is no longer documented; worksheets are now deprecated.
Adding a Calendar Widget
A dashboard can include a calendar widget like the following:
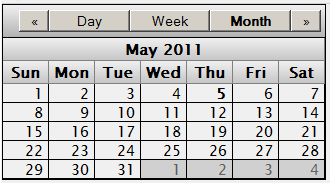
To add a calendar widget:
-
Click Menu > Add New Widget....
-
In the left area, click Calendar and then click Calendar.
-
Optionally specify the basic settings, as described in Adding a Widget to a Dashboard.
-
Click OK.
When you open a dashboard, this widget displays the current month, for informational purposes.
Adding a Map Widget
If your cube includes latitude and longitude data, you can include a map widget like the following on your dashboards:
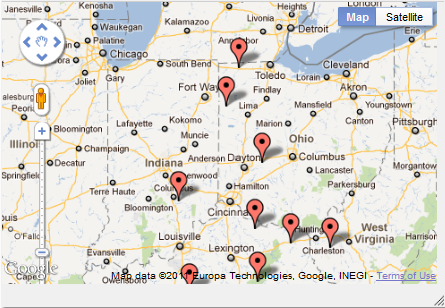
This widget uses the Google Maps API. Be sure that your usage of this API is consistent with the Terms of Use, which you can access via a link in the widget, shown in the previous picture.
To add a map widget:
-
Obtain and enter a key for the Google Maps API. See Specifying Basic Settings for more information.
-
Optionally, in the Analyzer, define a pivot table that includes the columns Latitude and Longitude (not case-sensitive).
These columns should contain latitude and longitude values in decimal format (rather than degree/minute/second format).
For information on creating pivot tables, see Using the Analyzer.
You do not have to provide a data source for a map widget. If you provide no data source, the widget appears without any pins.
-
Display the dashboard.
-
Click Menu > Add New Widget....
-
In the left area, click Map and then click Map.
-
For Data source, select the previously defined pivot table.
-
Optionally specify the basic settings, as described in Adding a Widget to a Dashboard.
-
Click OK.
-
Optionally configure the widget further as follows:
-
Select the widget, as described in Reconfiguring a Widget.
-
Click Widget Settings.
-
Specify the following additional options:
-
Zoom — Initial zoom setting to use. A larger number results in a closer view.
-
Starting latitude — Initial latitude to display, in degrees.
-
Starting longitude — Initial longitude to display, in degrees.
-
Draggable markers — Controls whether the user can drag the map markers.
-
-
Configuring the infoWindow Popup
If the underlying pivot table contains data in addition to latitude and longitude, you can configure the map widget to display that data. If the user clicks a pin in the map widget, the widget displays a popup window that displays the additional information.
-
Access the Dashboard Editor and select the widget as described in Reconfiguring a Widget.
-
Click Data Properties.
The system displays a list of any properties defined for this map widget.
-
Click the plus sign + button.
The system displays a dialog box where you specify the property.
-
Specify the following options:
-
Label — Optionally specify the text to use as the column header. (Note that you cannot force a line break in this label.)
-
Data Value — Specify the value to display. Select a data source property. You cannot use a static value or a formula in this scenario.
-
Format — Optionally specify a format string.
-
-
Click OK.
Adding a Widget That Uses a Portlet
To add a widget that uses a custom portlet:
-
Click Menu > Add New Widget....
-
In the left area, click Portlet. The list expands to show a list of choices. This list shows the short class names for all compiled portlets in this namespace.
-
Click the name of the portlet to add.
-
Optionally specify the basic settings, as described in Adding a Widget to a Dashboard.
-
Click OK.
For information on creating portlets, see Implementing InterSystems Business Intelligence.
Adding a Controls Widget
To add a controls widget:
-
Click Menu > Add New Widget....
-
In the left area, click Controls Widget. The list expands to show a list of choices. Click the type of Controls Widget to add.
-
For the Data Source, do one of the following:
-
Click the Search button
 and then select a data source.
 -
Use the Link to drop-down list to select another widget on the same dashboard.
-
-
Optionally specify the basic settings, as described in Adding a Widget to a Dashboard.
-
Click OK.
-
Optionally configure the widget further as described in the rest of this page.
-
Optionally add controls, as described in Adding Widget Controls.
Note that it is not possible to hide the toolbar for a controls widget.