
Specifying the Columns in a Pivot Table
Specifying the Columns in a Pivot Table
The columns of a pivot table are controlled by Measures and Columns:
-
For the Columns box, you can drag and drop any of the items that you can use for Rows. See the preceding section for information on the items and details on the options.
-
You can drag and drop only measures from the Model Contents pane to Measures.
Measures are always used as the innermost grouping. For example, consider the following pivot table configuration:
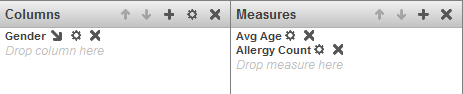
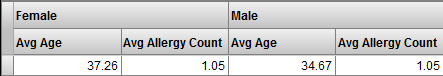
This pivot table looks as follows:
Note:
The system does not display more than 100 columns.