
Displaying Measures in a Pivot Table
Displaying Measures in a Pivot Table
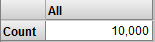
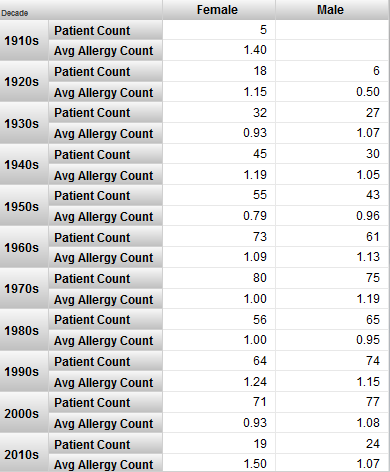
By default, the Analyzer displays the count of lowest-level records. For example:
Within the body of the pivot table, you can instead display one or more measures, quality measures, or plug-in properties, in any combination. Note that you can use measures, quality measures, and plug-in properties (usually referred to as plug-ins) interchangeably. This section uses the generic term measures to refer to all of these items.
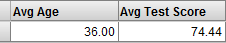
To display a measure as a column, drag and drop it into the Measures box or the Columns box. For example:
| Measures | Pivot Table |
|---|---|
|
Avg Age measure Avg Test Score measure |
 |
Or double-click the measure in the Model Contents pane.
Or drag and drop a measure to the Rows box, as discussed earlier. Note that if you display a measure as a row and another measure as a column, the system displays only the value of the measure that is used as a column.
The following subsections discuss additional topics:
Pivot Tables with One Measure
To display measures as columns, you can drag and drop them to the Measures box or to the Columns box. If the pivot table has multiple measures, the resulting pivot table (and underlying MDX query) is identical with either technique. If the pivot table has only a single measure, however, the two techniques generate slightly different MDX queries:
| Technique | Comments |
|---|---|
| Drag and drop the measure to the Measures box | The underlying MDX query uses the measure in its filter clause. This means that this pivot table cannot be displayed in a scorecard (on a dashboard). |
| Drag and drop the measure to the Columns box | The underlying MDX query uses the measure as a column. This pivot table can be displayed in a scorecard. |
Pivot Tables with Multiple Measures
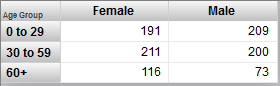
If you drag and drop multiple measures to the Measures box, you can specify whether the measures are used as columns (as in the default case) or as rows. To do so, click the Options button  in the Measures box. The system displays a dialog box; for this discussion, use the options in the section Place measures on. Choose one of the following:
-
Rows — Displays the measures as rows.
-
Columns — Displays the measures as columns.
Then click OK.
This option makes it easier to redefine complex pivot tables, because you can rearrange the Rows box or Columns box and leave the measures alone.
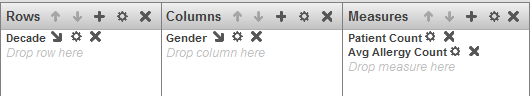
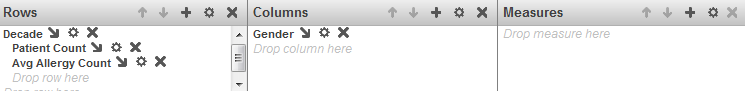
For example, consider the following pivot table definition:
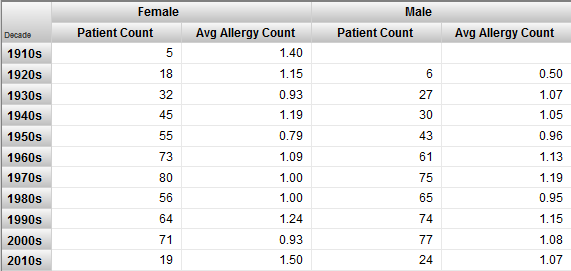
By default, the measures are used as columns (nested within the elements listed in the Columns box), as in the following example:
If you instead use the option to display the measures as rows, the pivot table looks like this:
This pivot table is equivalent to one defined as follows:
Controlling the Display of the Measure Headings
By default, when a pivot table displays a level on columns and displays measures, the pivot table may or may not include a heading for the measures, as follows:
-
If the pivot table has only one measure, the measure name is not shown. For example:
-
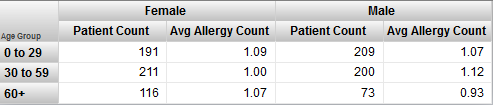
If the pivot table has multiple measures, the measure names are shown. For example:
You can control this behavior. To do so, click the Options button in the Measures box. The system displays a dialog box; for this discussion, use the options in the section Display measure headers. Choose one of the following options:
-
If More Than 1 Measure — The system displays the measure name if there is more than one measure, but does not display the name if there is only one measure.
-
Always — The system always displays the measure name.
-
Never — The system never displays the measure name.
These options apply only when the pivot table also displays another item on columns, as in the examples shown here.