Displaying Properties in a Pivot Table
Displaying Properties in a Pivot Table
You can display the properties of a level if you are also using that level as rows or columns. For example, if you display City as rows, you can display Principal Export as a column by dragging the property to the Columns box:
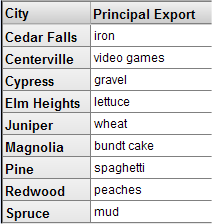
If you display City as columns, you can display Principal Export as a row:

Displaying Both Properties and Measures
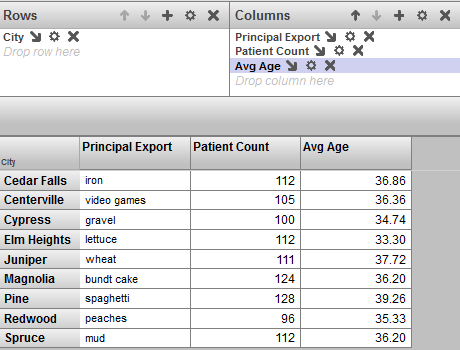
If you display a property as a column and you want to display a measure as another column, you must drag and drop the measure to Columns rather than to Measures. For example: