
Specifying the Rows
Specifying the Rows
To specify the rows in the pivot table, drag and drop items from the Model Contents pane to the Drop row here label in the Rows box. When you do so, the Rows box looks like this:
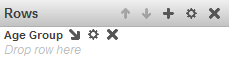
Now there are three places into which you can drag and drop additional items:
-
If you drag and drop onto the bold item label (Age Group in this case), the Analyzer replaces the existing item with the new one.
-
If you drag and drop onto Drop row here, the Analyzer adds additional rows to the table. For example:
Rows Pivot Table 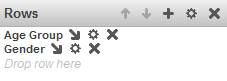
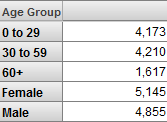
Note that you can hide the row caption; see Specifying Pivot Options.
-
If you drag and drop onto the Add Breakout button
 after the bold item label, the Analyzer subdivides the existing rows. For example:
Rows Pivot Table 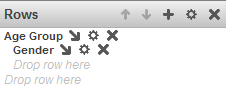
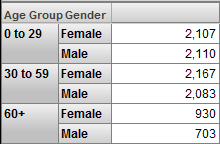
Notice that now there are two labels called Drop row here. The non-indented one affects the outermost grouping. The indented one affects the inner grouping.
When you nest levels this way, the system initially returns only the first 2,000 combinations of the levels. If there are more than 2,000 rows, the system displays the Show All button at the bottom of the pivot preview area. If you click this button, the system returns all the combinations, and you can page through them.
To remove an item from the rows, click the X button to the right of its label in the Rows box.
For information on the Advanced Options button  , see Customizing Pivot Table Items.