
Items That Can Be Used in the Rows Box
Items That Can Be Used in the Rows Box
You can use any combination of the following items in the Rows box:
-
Levels. This is the most common scenario. When you drag and drop a level to Rows, the query creates a set of all the members of that level, and uses those members for rows. For example:
Rows Pivot Table Allergies level 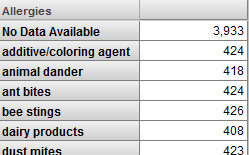
-
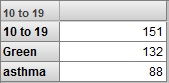
Members, including calculated members. You can drag and drop individual members to Rows. For example:
Rows Pivot Table 10 to 19 member of Age Bucket level Green member of Favorite Color level
asthma member of Allergies level
 Important:
To drag and drop a member, you must click the member name rather than the icon to its left.
Note that you can hide the row caption; see Specifying Pivot Options. This option is especially useful when you drag and drop individual members, because the name of the first member is also used as the caption for the rows, and this is not usually a suitable caption.
-
Dimensions, including calculated dimensions. If you drag and drop a dimension to Rows, the query uses all members of the first level of the first hierarchy of that dimension. For example:
Rows Pivot Table AgeD dimension 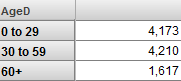
-
Named sets. If you drag and drop a named set to Rows, the query uses each item in that set as a separate row. For example:
Rows Pivot Table Sample Set 2 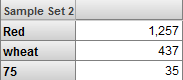
-
Measures. If you drag and drop a measure to Rows, the system uses that measure as a row. For example:
Rows Pivot Table Avg Age measure Avg Allergy Count measure
Avg Test Score measure
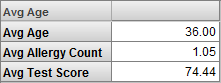
If there is only one column (as in the case shown here), the data shown for the measure is the aggregate value for that measure across all records (or across all included records, if the pivot table is filtered).
If the pivot table includes multiple columns corresponding to members, then the data in any column is the value for that measure for that member.
If the pivot table includes columns that correspond to measures, the column definition takes precedence and the value shown is determined by the measure used in the column.
Note that you can hide the row caption; see Specifying Pivot Options. This option is especially useful when you drag and drop measures to Rows, because the name of the first measure is also used as the caption for the rows, and this is not usually a suitable caption.
-
Level properties. See Displaying Properties in a Pivot Table.
-
Pivot variables. See Defining and Using Expression Pivot Variables.
-
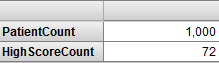
Plugins. For example:
Rows Pivot Table PatientCount plug-in property HighScoreCount plug-in property
You can also double-click a level, dimension, member, or named set in the Model Contents pane. If you do, the system removes any items currently in Rows and replaces them with what you double-clicked.
If hierarchies are displayed in the Model Contents pane, they are for informational purposes only; you cannot drag and drop them.