
Adding a Summary Row or Column as a Custom Aggregation
Adding a Summary Row or Column as a Custom Aggregation
This section describes how to add a summary row as a custom aggregation. The technique is easily adapted for a summary column.
-
For the level used as the rows, add the same level again to the Rows box.
-
Click the Advanced Options button
 next to the second level in Rows.
The Analyzer displays the Advanced Options page, which is discussed in detail later in this book.
-
Select Compute Aggregate and then select an aggregation function. You can use any of the following functions:
-
SUM — For each displayed measure, display the sum of the values of the members.
-
AVG — For each displayed measure, display the average of the values of the members.
-
MIN — For each displayed measure, display the minimum of the values of the members.
-
MAX — For each displayed measure, display the maximum of the values of the members.
-
COUNT — For each displayed measure, display the count of the members.
-
COUNT NONEMPTY — For each displayed measure, display the count of the members that have values in the current context.
-
AGGREGATE — For each displayed measure, display the aggregate value of the members, using the aggregation method defined for that measure.
-
MEDIAN — For each displayed measure, display the median of the values of the members.
-
STDDEV — For each displayed measure, display the standard deviation of the values of the members.
-
VARIANCE — For each displayed measure, display the variance of the values of the members.
-
PERCENTILE — For the given percentile value and for each displayed measure, display the measure value that is at that percentile value.
For this option, you can specify a percentile value in the Percentile field; the default is 50.
-
-
Optionally type a new caption into Caption. The default caption is the name of the function.
When you use this option, the system first uses any other settings you specified on this dialog box.
For example, consider the following pivot table:
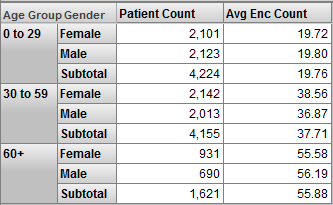
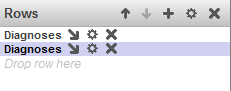
This pivot table is defined with the following items in Rows:
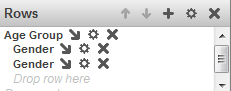
The second Gender item uses the following options:
-
Compute Aggregate is Aggregate
-
Caption is Subtotal