
Adding a Summary Row or Column as a Pivot Option
Adding a Summary Row or Column as a Pivot Option
To add a summary row, summary column, or both:
-
Click the Pivot Options button
 .
.The Analyzer displays the Pivot Options page, which is discussed in detail later in this book.
This procedure discusses only the Summary option.
-
Click the Summary check box.
-
Select a summary option from the drop-down list. The options are as follows:
-
Sum — Displays the sum of the values.
-
Count — Displays the count of rows.
-
Max — Displays the maximum of the values.
-
Min — Displays the minimum of the values.
-
Average — Displays the average of the values.
-
% of Total — Displays the sum of the values of this column (or row), as a percentage of the sums of all columns (or rows).
For information on overriding how the summary is computed for a given measure, see Specifying Alternative Aggregation Methods for a Measure.
-
-
(For summary rows only) Optionally, to cause the summary row to summarize all rows (including rows on later pages), select All Rows from the second drop-down list.
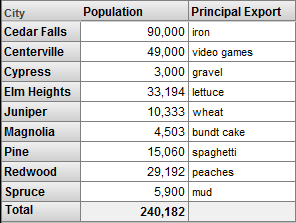
For example, the following pivot table includes a total row. Notice that it displays the total only for numeric values:
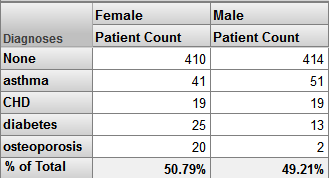
The following example shows % of Total, which is useful primarily when you use a level in Columns:
In contrast to the other forms of summaries, note the following:
-
If you display the pivot table as a chart, the chart does not include the summary row or column.
-
If you export to Excel, the summary is included only if it is a sum.