Pivot Tables with Multiple Measures
Pivot Tables with Multiple Measures
If you drag and drop multiple measures to the Measures box, you can specify whether the measures are used as columns (as in the default case) or as rows. To do so, click the Options button  in the Measures box. The system displays a dialog box; for this discussion, use the options in the section Place measures on. Choose one of the following:
-
Rows — Displays the measures as rows.
-
Columns — Displays the measures as columns.
Then click OK.
This option makes it easier to redefine complex pivot tables, because you can rearrange the Rows box or Columns box and leave the measures alone.
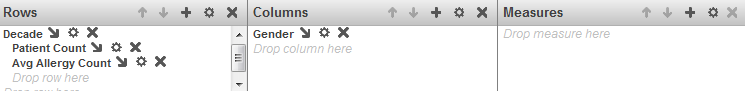
For example, consider the following pivot table definition:
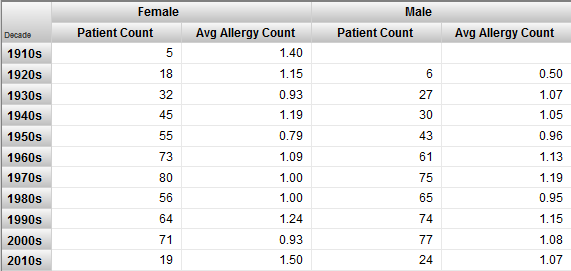
By default, the measures are used as columns (nested within the elements listed in the Columns box), as in the following example:
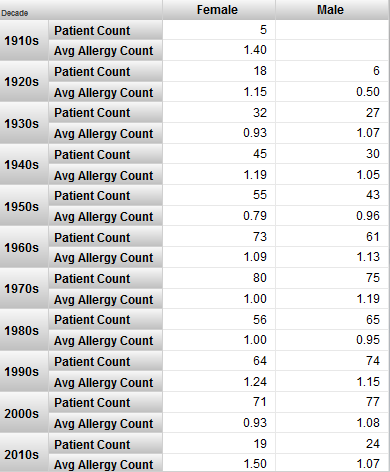
If you instead use the option to display the measures as rows, the pivot table looks like this:
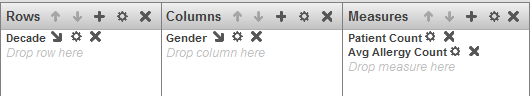
This pivot table is equivalent to one defined as follows: