
Examples
Examples
The following shows a simple example:
Class BI.Model.Custom.MyPortlet Extends %DeepSee.Component.Portlet.abstractPortlet
{
/// Static HTML display method: draw the BODY of this component as HTML.
Method %DrawHTML()
{
&html<<div class="portletDiv" style="overflow:hidden;">>
&html<<div style="font-size:16px; border-bottom:1px solid gray;">My Widget</div>>
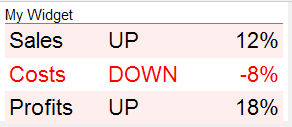
Set tInfo(1) = $LB("Sales","UP","12")
Set tInfo(2) = $LB("Costs","DOWN","-8")
Set tInfo(3) = $LB("Profits","UP","18")
&html<<table width="100%" cellspacing="0" border="0">>
Set n = $O(tInfo(""))
While (n'="") {
Set tName = $LG(tInfo(n),1)
Set tDir = $LG(tInfo(n),2)
Set tPct = $LG(tInfo(n),3)
Set clr = $S(tPct<0:"red",1:"black")
Set bg = $S(n#2:"#FFEEEE",1:"white")
Set tPct = tPct _ "%"
&html<<tr style="font-size:24px; background:#(bg)#;color:#(clr)#;">
<td style="padding:4px;">#(tName)#</td>
<td style="padding:4px;">#(tDir)#</td>
<td style="padding:4px;text-align:right;">#(tPct)#</td></tr>>
Set n = $O(tInfo(n))
}
&html<</table>>
&html<</div>>
}
}
When used as a widget, the widget has the following contents:
This example displays static data, but your portlet could display real-time data.
For a more complex example that also defines settings, see the sample class BI.Model.PortletDemo.ClockPortlet.