
Filters
Filters
In BI applications, it is critical to be able to filter data in pivot tables and in other locations. This section discusses the filter mechanisms in Business Intelligence and how you can use them in your application.
Filter Mechanisms
The system provides two simple ways to filter data: member-based filters and measure-based filters. You can combine these, and more complex filters are also possible, especially if you write MDX queries directly.
Member-Based Filters
A member is a set of records. In the simplest member-based filter, you use a member to filter the pivot table (for example, other contexts are possible, as this section describes later). This means that the pivot table accesses only the records that belong to that member.
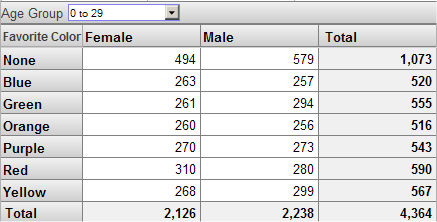
For example, consider the following pivot table, as seen in the Analyzer:
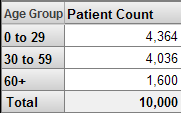
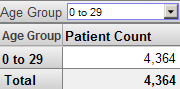
Suppose that we apply a filter that uses the 0 to 29 member of the Age Group level. The resulting pivot table looks like this:
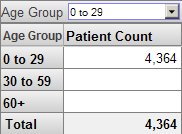
The Analyzer provides options to display null rows and columns. If we display null rows, the pivot table looks like this:
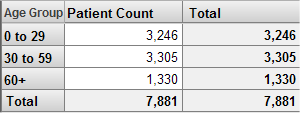
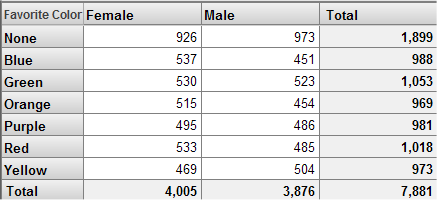
We can use the same filter in any pivot table. For example, consider the following unfiltered pivot table:
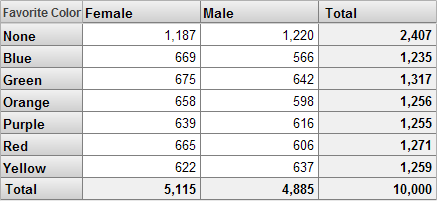
This pivot table shows the Patient Count measure although the headings do not indicate this. If we filter this pivot table in the same way as the previous one, we see this:
Notice that the total record count is the same in both cases; in both cases, we are accessing only patients that belong to the 0 to 29 member.
You can also use multiple members together in a filter, and you can combine filters that refer to members of different levels. Also, rather than choosing the members to include, you can choose the members to exclude.
Member-based filters are so easy to create and so powerful that it is worthwhile to create levels whose sole purpose is for use in filters.
Measure-Based Filters
The system supports searchable measures. With such a measure, you can apply a filter that considers the values at the level of the source record itself.
For the Patients sample, you can have a filter that accesses only the patients who have an encounter count of 10 or higher. If we use this filter in a pivot table, we might see this:
If we use the same filter in a different pivot table, we might see this:
In both cases, the total patient count is the same, because in both cases, the pivot table uses only the patients who have at least 10 encounters.
A searchable measure can also contain text values. With such measures, you can use the operators = <> and LIKE to filter the records.
More Complex Filters
It is possible to create more complex filters that combine member- and measure-based filters. The following shows an example of such a filter, as created in the Analyzer:
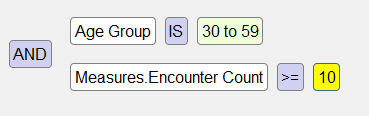
Internally, the query does not use AND and OR, but instead uses MDX syntax. All Business Intelligence filters use MDX syntax.
You can also create filters that use MDX functions. For example:
-
The FILTER function uses the aggregate values of a measure, rather than the lowest-level values which a measure-based filter uses. For example, you can use this to filter out patients who belong to cities that have fewer than 1000 patients.
In the Analyzer, the Levels option for a row or column uses this function internally.
-
The EXCEPT function can be used to remove specific members. The system uses this function when you create a member-based filter that excludes your selected members.
InterSystems MDX provides many other functions that perform set operations.
-
The TOPCOUNT and other functions access members based on their ranking.
For an introduction to MDX and a survey of your options, see Using InterSystems MDX. Also see InterSystems MDX Reference.
Using Filters
When you define a pivot table, you can specify how it is filtered. In practice, however, it is undesirable to create multiple similar pivot tables with different filters, because the pivot tables can become difficult to maintain. Instead, you can use any or all of the following tools:
-
In the Analyzer, you can define named filters, which you can then use in multiple pivot tables. A named filter is available in the Analyzer along with the contents of the cube or subject area (see the next item).
-
In the Architect, you can define subject areas that are filtered views of a base cube. Then when you create pivot tables, you start with a subject area rather than with the cube itself. These pivot tables are always filtered by the subject area filter, in addition to any filters that are specific to the pivot tables themselves.
In a subject area, you can specify a hardcoded filter, or you can customize a callback method to specify the filter at runtime (to base it on a value such as $roles, for example).
-
In the User Portal, when you create dashboards, you can include filter controls in them (this applies only to simple, member-based filters). Then the user can select the member or members to include or exclude.
Filters are always cumulative.