
Using a Fact Table
Using a Fact Table
Consider the following pivot table:
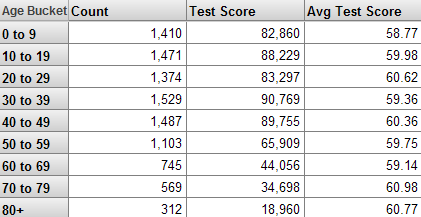
The first column displays the names of the members of the Age Bucket level. The first data column shows the Patient Count measure, the second data column shows the Test Score measure, and the last column shows the Avg Test Score measure. The Avg Test Score measure is a calculated member.
The system determines these values as follows:
-
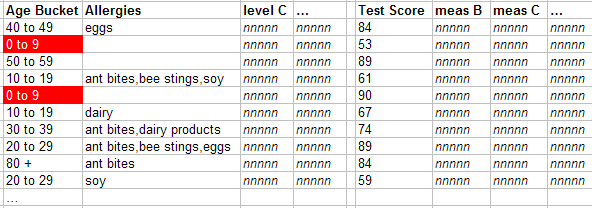
The first row refers to the 0-9 member of the Age Bucket level. The system uses the indexes to find all the relevant patients (shown here with red highlighting) in the fact table:
-
In the pivot table, the Patient Count column shows the count of patients used in a given context.
For the first cell in this column, the system counts the number of records in the fact table that it has found for the 0-9 member.
-
In the pivot table, the Test Score column shows the cumulative test score for the patients in a given context.
For the first cell in this column, the system first finds the values for the Test Score in the fact table that it has found for the 0-9 member:
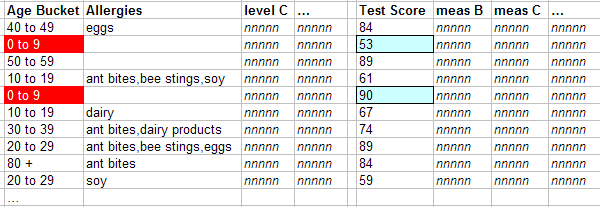
Then it aggregates those numbers together, in this case by adding them.
-
In the pivot table, the Avg Test Score column is meant to display the average test score for the patients in a given context.
The Avg Test Score measure is a calculated member, computed by dividing Test Score with Patient Count.
The system repeats these steps for all cells in the result set.