
How the System Generates Listings
How the System Generates Listings
This section describes how the system uses the listings defined in the cube.
Within a pivot table, a user selects one or more cells.
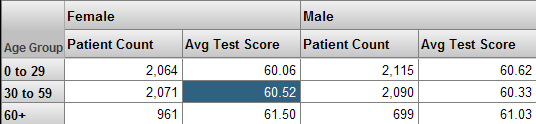
The user then clicks the Listing button  , and the system displays a listing, which shows the values for the lowest-level records associated with the selected cells (also considering all filters that affect this cell):
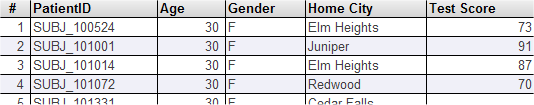
To generate this display, the system:
-
Creates an temporary listing table that contains the set of source ID values that correspond to the facts used in the selected cells.
-
Generates an SQL query that uses this listing table along with the definition of your listing.
-
Executes this SQL query and displays the results.
Your cube can contain multiple listings (to show different fields for different purposes). When you create a pivot table in the Analyzer, you can specify which listing to use for that pivot table.
The listing query is executed at runtime and uses the source data rather than the fact table. Because of this, if the fact table is not completely current, it is possible for the listing to show a different set of records than you see in the fact table.